Summary Table (Download Table)
| Co-regulatory TF | Tissue | -log(P) |
  | | |
| ZID | larynx | 7.31583 |
| ZID | kidney | 6.94653 |
| XBP-1 | kidney | 8.70626 |
| WHN | tongue | 8.57607 |
| VDR | brain | 7.16589 |
| TGIF | heart | 6.30719 |
| TFII-I | thymus | 7.25094 |
| TBP | brain | 7.05185 |
| TAX/CREB | thymus | 9.59345 |
| TAX/CREB | kidney | 7.13135 |
| TATA | placenta | 7.51868 |
| STAT1 | bone_marrow | 6.33693 |
| SREBP-1 | kidney | 10.059 |
| SP1 | tongue | 6.84421 |
| SP1 | larynx | 6.27348 |
| RSRFC4 | heart | 7.67415 |
| RREB-1 | thymus | 6.37424 |
| PEA3 | bone_marrow | 6.22737 |
| PEA3 | blood | 7.24988 |
| PAX-3 | tongue | 9.53757 |
| NRF-1 | tongue | 7.25407 |
| NRF-1 | thymus | 6.54078 |
| NRF-1 | larynx | 8.22283 |
| NRF-1 | bone_marrow | 7.85627 |
| NR2E3 | kidney | 6.56758 |
| NF-Y | tongue | 7.54156 |
| NF-Y | pancreas | 6.31354 |
| NF-Y | ovary | 6.76608 |
| NF-MUE1 | pancreas | 7.23206 |
| NCX | kidney | 6.60441 |
| MZF1 | ovary | 6.5202 |
| LUN-1 | small_intestine | 6.67906 |
| LHX3 | placenta | 18.812 |
| LBP-1 | blood | 8.85579 |
| HNF-1 | small_intestine | 6.17487 |
| HNF-1 | kidney | 8.23878 |
| GATA-X | kidney | 7.48408 |
| ERR_ALPHA | placenta | 6.68971 |
| ELK-1 | bone_marrow | 7.05187 |
| E4F1 | tongue | 14.2226 |
| E4F1 | kidney | 9.40202 |
| E4BP4 | kidney | 6.7565 |
| E2F | tongue | 6.34458 |
| CREB | tongue | 26.2224 |
| CREB | testis | 7.21664 |
| CREB | kidney | 15.239 |
| CRE-BP1/C-JUN | tongue | 13.6031 |
| CRE-BP1/C-JUN | testis | 7.13672 |
| CRE-BP1 | tongue | 10.6759 |
| CHX10 | placenta | 11.5634 |
| CDP_CR3 | tongue | 6.44896 |
| C-MYC/MAX | thymus | 6.44674 |
| ATF4 | tongue | 8.15057 |
| ATF4 | kidney | 6.37091 |
| ATF3 | tongue | 13.7512 |
| ATF-1 | tongue | 16.2351 |
| ATF-1 | testis | 6.39423 |
| ATF | tongue | 27.8854 |
| ATF | thymus | 10.2693 |
| ATF | testis | 8.07803 |
| ATF | kidney | 9.99283 |
| ATF | bone | 10.0521 |
| ARNT | kidney | 6.35951 |
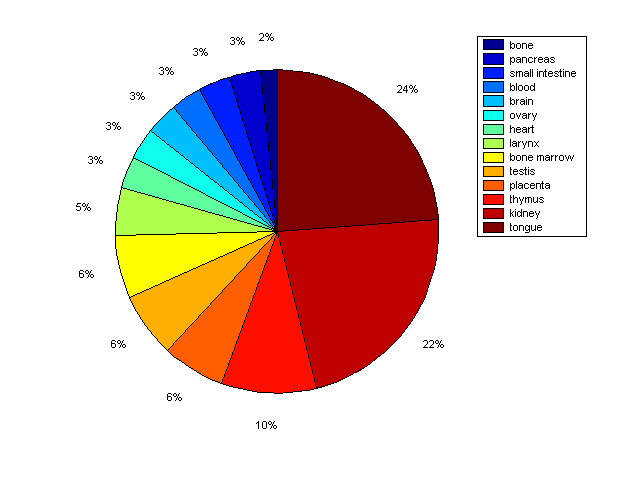
Distribution of Co-regulatory TFs
|
|
|
Description: this pie chart displays the distribution of co-regulatory transcription factors (TFs) in different tissues. Color schema: the tissue with the largest percentage of co-regulatory TFs is colored dark red whereas the tissue with the smallest percentage of co-regulatory TFs is colored dark blue. Tissues with intermediate percentages of co-regulatory TFs are colored from light red to yellow and cyan and then to light blue. |