Summary Table (Download Table)
| Co-regulatory TF | Tissue | -log(P) |
  | | |
| TCF-4 | pancreas | 6.19128 |
| GATA-6 | placenta | 6.20473 |
| MEF-2 | bone_marrow | 6.22629 |
| ISRE | lymph_node | 6.23854 |
| IRF-1 | brain | 6.25365 |
| SP3 | spleen | 6.25414 |
| TFII-I | thymus | 6.29555 |
| ATF | cervix | 6.30776 |
| MZF1 | thymus | 6.32035 |
| MYOD | pancreas | 6.38544 |
| CRE-BP1 | testis | 6.39423 |
| FOXJ2 | brain | 6.40726 |
| NF-KAPPAB_(P50) | soft_tissue | 6.46136 |
| NRF-1 | bone_marrow | 6.48869 |
| NRL | pancreas | 6.53303 |
| FAC1 | bladder | 6.55097 |
| FREAC-3 | pancreas | 6.55682 |
| SMAD-3 | pancreas | 6.61714 |
| PAX-3 | tongue | 6.7362 |
| PAX-2 | pancreas | 6.79016 |
| CART-1 | peripheral_nervous_system | 6.81728 |
| PEA3 | bone_marrow | 6.84318 |
| CHX10 | brain | 6.8576 |
| BSAP | thymus | 6.88271 |
| STAT6 | eye | 6.88597 |
| CREB | thymus | 6.93494 |
| PPARG | larynx | 6.93834 |
| NRF-1 | lung | 7.00573 |
| BSAP | bone | 7.07003 |
| NF-Y | eye | 7.16445 |
| STAT4 | pancreas | 7.1948 |
| RSRFC4 | muscle | 7.19638 |
| RREB-1 | peripheral_nervous_system | 7.24737 |
| PPARALPHA/RXR-ALPHA | placenta | 7.25589 |
| AFP1 | placenta | 7.42144 |
| NCX | pancreas | 7.57507 |
| HFH-4 | peripheral_nervous_system | 7.59482 |
| E2F-1/DP-2 | bone | 7.65412 |
| MIF-1 | testis | 7.66858 |
| AP-1 | bone_marrow | 7.69703 |
| MZF1 | ovary | 7.71811 |
| PPARALPHA/RXR-ALPHA | pancreas | 7.72406 |
| FAC1 | tongue | 7.77259 |
| CACCC-BINDING_FACTOR | thymus | 7.91375 |
| CRE-BP1/C-JUN | testis | 7.92053 |
| TAX/CREB | pancreas | 7.95147 |
| ER | larynx | 7.97148 |
| CRE-BP1/C-JUN | tongue | 7.99817 |
| NKX6-2 | placenta | 8.08386 |
| NF-Y | tongue | 8.08982 |
| E2F-1 | bone | 8.15753 |
| E2F-1/DP-1 | bone | 8.16268 |
| TATA | placenta | 8.21286 |
| STAT3 | bone_marrow | 8.2157 |
| ALX-4 | eye | 8.24818 |
| TAX/CREB | thymus | 8.26946 |
| CRE-BP1/C-JUN | bone | 8.29721 |
| NRSF | eye | 8.31209 |
| E2F-4/DP-2 | bone | 8.38849 |
| MAZ | thymus | 8.40965 |
| MEF-2 | pancreas | 8.53225 |
| ATF-1 | bone | 8.54179 |
| HAND1/E47 | pancreas | 8.5806 |
| AP-3 | peripheral_nervous_system | 8.64923 |
| ATF | placenta | 8.77723 |
| HEB | pancreas | 8.80577 |
| ATF | testis | 8.84743 |
| ATF3 | bone | 8.88046 |
| VDR | placenta | 8.94541 |
| CREB | testis | 8.99311 |
| CREB | bone | 9.30692 |
| WHN | tongue | 9.4224 |
| NF-Y | peripheral_nervous_system | 9.42889 |
| AR | brain | 9.72062 |
| NRSF | pancreas | 10.1517 |
| E4F1 | tongue | 11.4739 |
| ATF3 | tongue | 13.3117 |
| CRE-BP1 | tongue | 16.2351 |
| ATF | tongue | 17.252 |
| CREB | tongue | 17.9717 |
| NRF-1 | tongue | 18.4884 |
| ATF | bone | 20.0037 |
| CHX10 | placenta | 21.47 |
| LHX3 | placenta | 35.2944 |
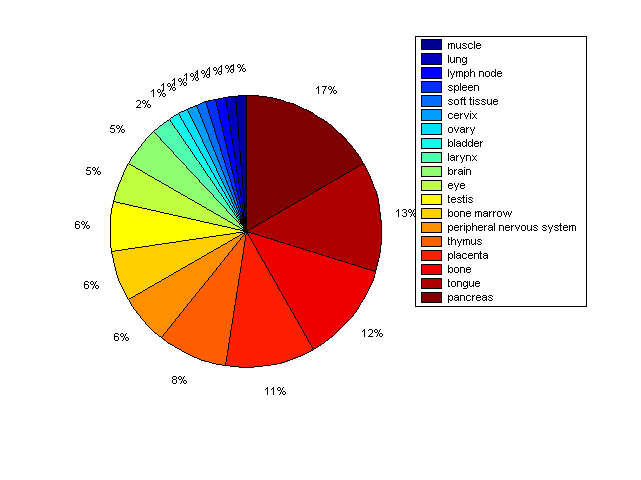
Distribution of Co-regulatory TFs
|
|
|
Description: this pie chart displays the distribution of co-regulatory transcription factors (TFs) in different tissues. Color schema: the tissue with the largest percentage of co-regulatory TFs is colored dark red whereas the tissue with the smallest percentage of co-regulatory TFs is colored dark blue. Tissues with intermediate percentages of co-regulatory TFs are colored from light red to yellow and cyan and then to light blue. |