Summary Table (Download Table)
| Co-regulatory TF | Tissue | -log(P) |
  | | |
| PAX-2 | eye | 6.16476 |
| SP3 | heart | 6.17589 |
| ATF | pancreas | 6.18181 |
| STAT3 | tongue | 6.20567 |
| ALX-4 | lung | 6.22691 |
| CHX10 | small_intestine | 6.24695 |
| MAX | larynx | 6.27355 |
| FOXO3 | small_intestine | 6.28833 |
| TAX/CREB | small_intestine | 6.29725 |
| BACH1 | eye | 6.30542 |
| E2F | small_intestine | 6.34305 |
| AP-1 | muscle | 6.36128 |
| E2F-4/DP-1 | small_intestine | 6.37268 |
| OCT-1 | brain | 6.44178 |
| AP-2ALPHA | tongue | 6.463 |
| SREBP-1 | peripheral_nervous_system | 6.49803 |
| RFX1 | thymus | 6.53585 |
| GATA-3 | small_intestine | 6.53606 |
| E12 | tongue | 6.54399 |
| ALPHA-CP1 | peripheral_nervous_system | 6.55826 |
| WHN | small_intestine | 6.56516 |
| MAZ | small_intestine | 6.60239 |
| OCT-1 | small_intestine | 6.61026 |
| OCT-1 | eye | 6.61072 |
| ATF | spleen | 6.68159 |
| LUN-1 | small_intestine | 6.68339 |
| C/EBPBETA | liver | 6.68364 |
| NF-Y | brain | 6.68861 |
| EGR-3 | eye | 6.70418 |
| CART-1 | small_intestine | 6.70656 |
| AHR/ARNT | brain | 6.7193 |
| AREB6 | larynx | 6.72832 |
| ATF | eye | 6.73368 |
| RREB-1 | brain | 6.81106 |
| LHX3 | placenta | 6.85603 |
| MEF-2 | heart | 6.87902 |
| DBP | eye | 6.88681 |
| TBP | peripheral_nervous_system | 6.89646 |
| NF-KAPPAB | spleen | 6.97209 |
| MEIS1B/HOXA9 | small_intestine | 6.99039 |
| E47 | tongue | 6.99853 |
| MZF1 | small_intestine | 7.03184 |
| FREAC-4 | spleen | 7.08819 |
| PAX-2 | tongue | 7.12055 |
| CRX | small_intestine | 7.13602 |
| CRE-BP1/C-JUN | peripheral_nervous_system | 7.14016 |
| MTF-1 | small_intestine | 7.14802 |
| PAX-2 | larynx | 7.22505 |
| OCT-1 | peripheral_nervous_system | 7.24045 |
| AHR/ARNT | small_intestine | 7.29216 |
| NF-Y | thymus | 7.30098 |
| SMAD-3 | mammary_gland | 7.30136 |
| E2F-1 | larynx | 7.35716 |
| USF | larynx | 7.43429 |
| GATA-6 | eye | 7.45003 |
| TFII-I | brain | 7.48234 |
| NF-KAPPAB_(P65) | spleen | 7.56347 |
| IPF1 | peripheral_nervous_system | 7.63945 |
| AREB6 | tongue | 7.64653 |
| NF-Y | bladder | 7.67836 |
| C/EBP | peripheral_nervous_system | 7.81823 |
| NF-Y | tongue | 7.99567 |
| USF | muscle | 8.02013 |
| NR2E3 | eye | 8.02796 |
| TATA | brain | 8.03295 |
| RSRFC4 | muscle | 8.10028 |
| MEF-2 | larynx | 8.15473 |
| NF-Y | blood | 8.17797 |
| MAZ | brain | 8.22191 |
| LMO2_COMPLEX | eye | 8.31436 |
| E4F1 | eye | 8.34984 |
| ATF6 | bone | 8.35138 |
| FOXO1 | eye | 8.39483 |
| TATA | small_intestine | 8.42242 |
| CREB | eye | 8.47895 |
| PBX1B | eye | 8.57823 |
| NF-Y | testis | 8.65085 |
| MAZR | lung | 8.65701 |
| TAL-1BETA/E47 | muscle | 8.91822 |
| TCF-4 | small_intestine | 8.92985 |
| MEF-2 | muscle | 9.04931 |
| BSAP | bladder | 9.14493 |
| POU3F2 | peripheral_nervous_system | 9.1915 |
| CRX | eye | 9.5751 |
| ZIC2 | eye | 9.64357 |
| NF-Y | peripheral_nervous_system | 9.74304 |
| MYOD | muscle | 9.93598 |
| STAT3 | larynx | 10.1811 |
| CDP | peripheral_nervous_system | 10.2478 |
| MEIS1A/HOXA9 | small_intestine | 10.2643 |
| CHOP-C/EBPALPHA | brain | 10.2647 |
| AP-4 | small_intestine | 10.2923 |
| C/EBP | brain | 10.5014 |
| GATA-1 | eye | 10.7371 |
| SRF | heart | 11.5243 |
| PPAR | peripheral_nervous_system | 11.5693 |
| CHX10 | brain | 12.0298 |
| NRSF | brain | 15.3938 |
| HNF-1 | small_intestine | 20.9774 |
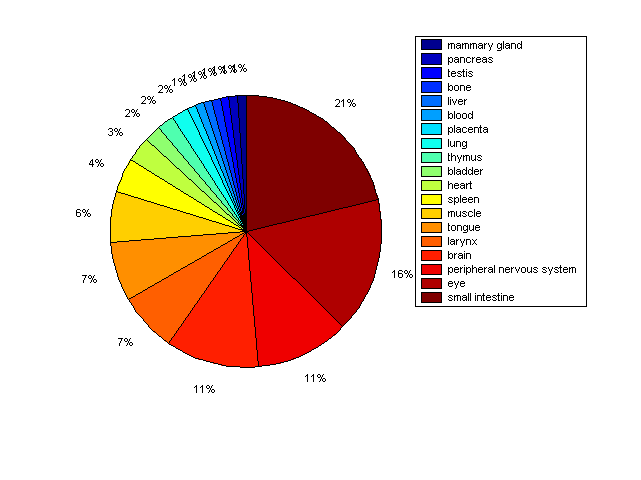
Distribution of Co-regulatory TFs
|
|
|
Description: this pie chart displays the distribution of co-regulatory transcription factors (TFs) in different tissues. Color schema: the tissue with the largest percentage of co-regulatory TFs is colored dark red whereas the tissue with the smallest percentage of co-regulatory TFs is colored dark blue. Tissues with intermediate percentages of co-regulatory TFs are colored from light red to yellow and cyan and then to light blue. |