Summary Table (Download Table)
| Co-regulatory TF | Tissue | -log(P) |
  | | |
| YY1 | heart | 7.10669 |
| XBP-1 | heart | 10.9644 |
| WHN | tongue | 6.92349 |
| WHN | larynx | 6.79978 |
| USF | larynx | 6.61052 |
| USF | bone_marrow | 6.60591 |
| STAT3 | tongue | 6.5372 |
| SRF | heart | 7.40664 |
| SREBP-1 | bone_marrow | 6.43471 |
| SP1 | tongue | 6.35973 |
| RREB-1 | larynx | 7.24547 |
| POU1F1 | peripheral_nervous_system | 6.97573 |
| PAX-8 | heart | 7.72635 |
| NRF-1 | tongue | 7.96064 |
| NRF-1 | small_intestine | 6.26247 |
| NRF-1 | larynx | 8.00202 |
| NRF-1 | bone_marrow | 6.31656 |
| NRF-1 | bladder | 6.94308 |
| NKX6-1 | peripheral_nervous_system | 7.73785 |
| NF-Y | peripheral_nervous_system | 6.29101 |
| NF-Y | bladder | 7.4123 |
| NF-KAPPAB_(P50) | tongue | 10.5902 |
| NF-KAPPAB | tongue | 8.07733 |
| MYOGENIN/NF-1 | brain | 7.41511 |
| MRF-2 | bone | 7.89264 |
| MEF-2 | brain | 11.8703 |
| MEF-2 | bone | 6.69918 |
| LHX3 | small_intestine | 6.34451 |
| HNF-1 | peripheral_nervous_system | 8.63267 |
| GCNF | mammary_gland | 7.99743 |
| GATA-4 | thymus | 6.46389 |
| FAC1 | heart | 11.1963 |
| ETF | tongue | 13.1439 |
| ETF | larynx | 8.66196 |
| E2F-4/DP-2 | tongue | 6.39286 |
| E2F-1/DP-2 | tongue | 6.33691 |
| E2F-1/DP-1 | tongue | 7.45215 |
| E2F-1 | tongue | 8.15381 |
| E2F | larynx | 7.79913 |
| CREB | tongue | 6.24424 |
| CREB | brain | 6.16976 |
| C/EBPBETA | peripheral_nervous_system | 6.81126 |
| ATF3 | brain | 6.80798 |
| ATF | brain | 6.62753 |
| AP-2REP | brain | 6.51008 |
| AP-2 | tongue | 6.24526 |
| AMEF-2 | lung | 7.0913 |
| AHR/ARNT | larynx | 7.70708 |
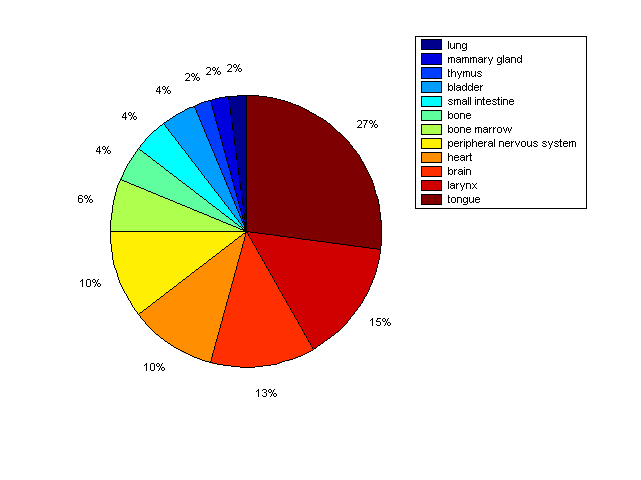
Distribution of Co-regulatory TFs
|
|
|
Description: this pie chart displays the distribution of co-regulatory transcription factors (TFs) in different tissues. Color schema: the tissue with the largest percentage of co-regulatory TFs is colored dark red whereas the tissue with the smallest percentage of co-regulatory TFs is colored dark blue. Tissues with intermediate percentages of co-regulatory TFs are colored from light red to yellow and cyan and then to light blue. |