Summary Table (Download Table)
| Co-regulatory TF | Tissue | -log(P) |
  | | |
| AP-2 | brain | 6.23188 |
| NRF-1 | blood | 6.27604 |
| ATF-1 | thymus | 6.29555 |
| P300 | larynx | 6.30461 |
| NF-KAPPAB_(P65) | bone | 6.35867 |
| MZF1 | thymus | 6.51658 |
| WHN | brain | 6.62926 |
| LXR | brain | 6.66608 |
| SRF | prostate | 6.69261 |
| NF-KAPPAB | larynx | 6.8279 |
| AML1 | larynx | 7.00533 |
| AML-1A | larynx | 7.00533 |
| ZID | muscle | 7.19098 |
| CRE-BP1 | thymus | 7.25094 |
| ELK-1 | larynx | 7.2953 |
| AP-2REP | brain | 7.38397 |
| E2F | larynx | 7.43691 |
| AP-2GAMMA | larynx | 7.44193 |
| VDR | brain | 7.47374 |
| ALPHA-CP1 | brain | 7.48234 |
| AREB6 | ovary | 7.62907 |
| AP-2ALPHA | larynx | 7.64822 |
| MEF-2 | muscle | 7.68541 |
| EGR-3 | brain | 7.7054 |
| TAX/CREB | thymus | 8.02603 |
| NRSF | brain | 8.03573 |
| SREBP-1 | thymus | 8.11404 |
| TATA | muscle | 8.11832 |
| SP3 | brain | 8.12352 |
| SMAD-4 | mammary_gland | 8.23629 |
| HNF-1 | colon | 8.2853 |
| FOXD3 | larynx | 8.34814 |
| MAZ | brain | 8.57719 |
| ETF | brain | 9.914 |
| MYOD | brain | 10.7787 |
| HEB | brain | 12.0255 |
| RREB-1 | larynx | 15.0496 |
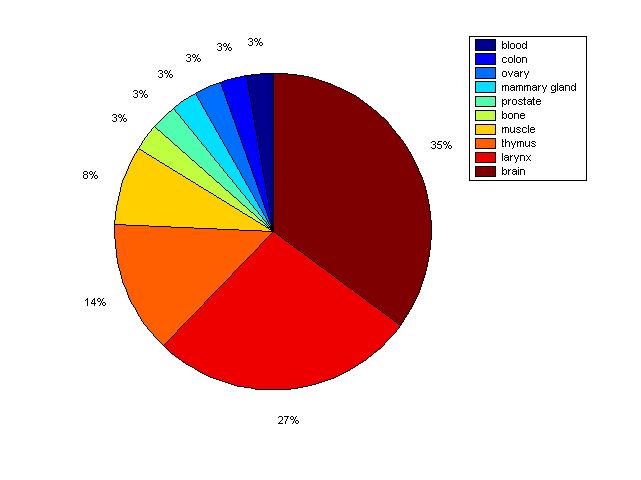
Distribution of Co-regulatory TFs
|
|
|
Description: this pie chart displays the distribution of co-regulatory transcription factors (TFs) in different tissues. Color schema: the tissue with the largest percentage of co-regulatory TFs is colored dark red whereas the tissue with the smallest percentage of co-regulatory TFs is colored dark blue. Tissues with intermediate percentages of co-regulatory TFs are colored from light red to yellow and cyan and then to light blue. |