Summary Table (Download Table)
| Co-regulatory TF | Tissue | -log(P) |
  | | |
| NRF-1 | testis | 6.69208 |
| LXR | testis | 6.54426 |
| HEB | testis | 6.51734 |
| SREBP-1 | stomach | 6.18102 |
| AP-1 | stomach | 6.40234 |
| HEB | spleen | 7.92618 |
| LUN-1 | soft_tissue | 6.42595 |
| TATA | skin | 7.32522 |
| OSF2 | skin | 6.33284 |
| MIF-1 | skin | 8.52813 |
| MAZ | ovary | 9.2144 |
| AP-4 | ovary | 8.0026 |
| TATA | muscle | 6.66119 |
| TAL-1BETA/ITF-2 | muscle | 6.92527 |
| SF-1 | muscle | 9.09769 |
| RSRFC4 | muscle | 13.7407 |
| MEF-2 | muscle | 13.1354 |
| TFII-I | mammary_gland | 8.23629 |
| MTF-1 | mammary_gland | 6.52705 |
| HNF-3ALPHA | mammary_gland | 6.33742 |
| C-ETS-1 | lymph_node | 9.03597 |
| HNF-1 | liver | 6.9151 |
| SRF | larynx | 10.3608 |
| P53 | larynx | 7.01157 |
| ELK-1 | larynx | 6.33644 |
| HNF-1 | kidney | 9.99824 |
| SRF | heart | 9.24643 |
| MEF-2 | heart | 11.4039 |
| RREB-1 | eye | 8.10958 |
| FREAC-3 | colon | 6.36304 |
| TGIF | brain | 7.34964 |
| TAX/CREB | brain | 6.97379 |
| SP3 | brain | 8.34605 |
| MTF-1 | brain | 11.4494 |
| MIF-1 | brain | 8.90361 |
| LMO2_COMPLEX | brain | 8.14417 |
| LBP-1 | brain | 10.1738 |
| HIF-1 | brain | 7.46384 |
| GR | brain | 10.2943 |
| GCM | brain | 11.3657 |
| EGR-3 | brain | 7.35273 |
| EGR-1 | brain | 8.39635 |
| E2F-4/DP-1 | brain | 9.36224 |
| E2F | brain | 8.76484 |
| C/EBP | brain | 6.83891 |
| ARNT | brain | 7.17332 |
| USF | bone_marrow | 6.67593 |
| SREBP-1 | bone_marrow | 7.25261 |
| NF-KAPPAB | bone_marrow | 8.18212 |
| ELK-1 | bone_marrow | 8.05007 |
| NF-KAPPAB_(P65) | bladder | 8.4613 |
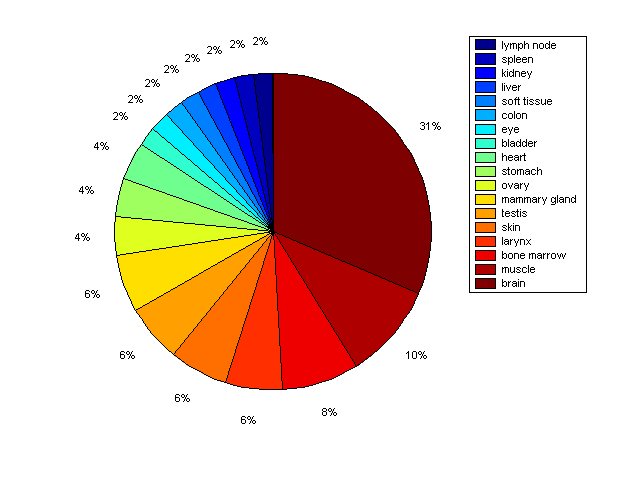
Distribution of Co-regulatory TFs
|
|
|
Description: this pie chart displays the distribution of co-regulatory transcription factors (TFs) in different tissues. Color schema: the tissue with the largest percentage of co-regulatory TFs is colored dark red whereas the tissue with the smallest percentage of co-regulatory TFs is colored dark blue. Tissues with intermediate percentages of co-regulatory TFs are colored from light red to yellow and cyan and then to light blue. |