Summary Table (Download Table)
| Co-regulatory TF | Tissue | -log(P) |
  | | |
| ALX-4 | muscle | 8.07769 |
| AMEF-2 | brain | 6.56256 |
| AML-1A | colon | 7.26311 |
| AML1 | colon | 7.26311 |
| ARP-1 | colon | 6.44064 |
| ARP-1 | small_intestine | 6.67864 |
| ATF | tongue | 6.25204 |
| C/EBP | kidney | 10.1397 |
| C/EBPALPHA | kidney | 7.69542 |
| C/EBPBETA | kidney | 7.29621 |
| CART-1 | brain | 6.64677 |
| CART-1 | peripheral_nervous_system | 7.14408 |
| CDP | peripheral_nervous_system | 7.75214 |
| CHX10 | kidney | 7.91894 |
| CRX | bladder | 7.64753 |
| CRX | kidney | 6.97093 |
| CRX | small_intestine | 6.65406 |
| E4BP4 | brain | 8.11519 |
| E4BP4 | small_intestine | 7.07773 |
| ELF-1 | bone_marrow | 7.09605 |
| FOXD3 | small_intestine | 9.77977 |
| FOXJ2 | eye | 6.30382 |
| FOXO1 | muscle | 7.27993 |
| FOXO3 | small_intestine | 8.76626 |
| FREAC-3 | small_intestine | 14.5764 |
| GATA-1 | peripheral_nervous_system | 8.98791 |
| GATA-1 | small_intestine | 6.36779 |
| GATA-X | small_intestine | 7.35076 |
| GCNF | small_intestine | 8.12571 |
| GR | small_intestine | 9.81408 |
| HFH-3 | brain | 7.51024 |
| HNF-1 | liver | 7.06594 |
| HNF-1 | small_intestine | 13.4023 |
| HNF-3ALPHA | small_intestine | 6.7038 |
| HNF-4ALPHA | small_intestine | 6.95665 |
| HNF-6 | peripheral_nervous_system | 8.23029 |
| IPF1 | kidney | 10.3716 |
| LBP-1 | muscle | 7.2512 |
| LBP-1 | small_intestine | 14.6058 |
| LXR | bone_marrow | 7.38368 |
| MAZ | small_intestine | 9.88819 |
| MEF-2 | muscle | 10.9824 |
| MEIS1A/HOXA9 | small_intestine | 7.39581 |
| MEIS1B/HOXA9 | small_intestine | 9.56941 |
| MIF-1 | bone | 7.34258 |
| MRF-2 | small_intestine | 11.1944 |
| NKX2-2 | ovary | 6.26478 |
| NKX6-2 | blood | 7.31211 |
| NKX6-2 | kidney | 10.664 |
| NKX6-2 | peripheral_nervous_system | 7.58199 |
| OCT-1 | brain | 9.01145 |
| OCT-1 | eye | 7.84573 |
| OCT-1 | peripheral_nervous_system | 6.41169 |
| OCT-1 | small_intestine | 9.50104 |
| PBX1B | eye | 6.61698 |
| PITX2 | peripheral_nervous_system | 10.4782 |
| POU3F2 | small_intestine | 8.3817 |
| RORALPHA1 | bone_marrow | 6.25579 |
| RREB-1 | larynx | 8.03457 |
| RSRFC4 | muscle | 6.33985 |
| RSRFC4 | small_intestine | 6.69943 |
| STAT4 | eye | 9.53309 |
| TAL-1ALPHA/E47 | small_intestine | 7.13473 |
| TATA | small_intestine | 12.6524 |
| TBP | brain | 6.95392 |
| TBP | peripheral_nervous_system | 9.10872 |
| TBP | small_intestine | 9.98318 |
| TCF11/MAFG | liver | 7.01946 |
| TITF1 | small_intestine | 7.24384 |
| TST-1 | brain | 9.32463 |
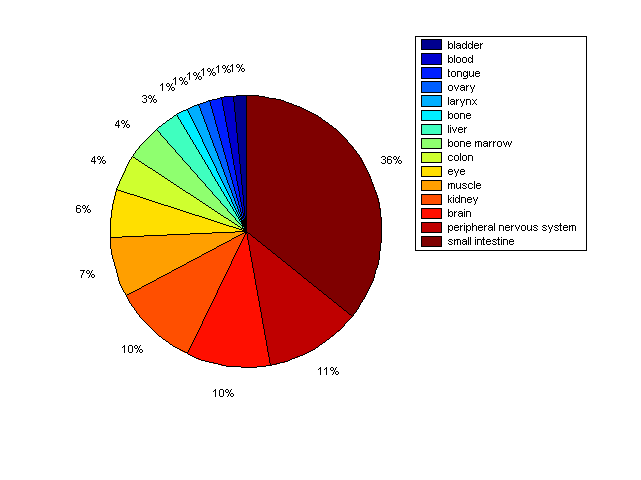
Distribution of Co-regulatory TFs
|
|
|
Description: this pie chart displays the distribution of co-regulatory transcription factors (TFs) in different tissues. Color schema: the tissue with the largest percentage of co-regulatory TFs is colored dark red whereas the tissue with the smallest percentage of co-regulatory TFs is colored dark blue. Tissues with intermediate percentages of co-regulatory TFs are colored from light red to yellow and cyan and then to light blue. |