Summary Table (Download Table)
| Co-regulatory TF | Tissue | -log(P) |
  | | |
| FAC1 | brain | 6.3273 |
| GATA-4 | brain | 7.20121 |
| HFH-3 | brain | 8.94372 |
| HNF-3ALPHA | brain | 7.0463 |
| OCT-1 | brain | 6.16673 |
| SOX-9 | brain | 7.50927 |
| SRY | brain | 7.00077 |
| C/EBP | eye | 7.03509 |
| GATA-6 | eye | 8.91499 |
| OCT-1 | eye | 8.26559 |
| SMAD-3 | eye | 6.77011 |
| TGIF | eye | 6.78216 |
| AP-3 | heart | 6.46345 |
| MEF-2 | heart | 7.44663 |
| HNF-1 | kidney | 15.9527 |
| SRF | larynx | 8.14905 |
| FREAC-4 | liver | 8.00344 |
| AP-1 | muscle | 10.2272 |
| C/EBPBETA | muscle | 10.5925 |
| HEB | muscle | 28.1386 |
| MEF-2 | muscle | 6.63073 |
| NF-1 | muscle | 11.5332 |
| NF-E2 | muscle | 6.19583 |
| NRSF | muscle | 7.21999 |
| RREB-1 | muscle | 7.85671 |
| TAL-1BETA/E47 | muscle | 7.12067 |
| TAL-1BETA/ITF-2 | muscle | 6.74581 |
| TITF1 | muscle | 6.19516 |
| USF | muscle | 6.92592 |
| MEIS1 | pancreas | 6.46186 |
| ATF | placenta | 6.76483 |
| CHX10 | placenta | 6.5769 |
| CRE-BP1 | placenta | 6.68971 |
| LHX3 | placenta | 9.80279 |
| POU3F2 | small_intestine | 7.02637 |
| TATA | small_intestine | 6.99812 |
| OCT-1 | thymus | 7.42752 |
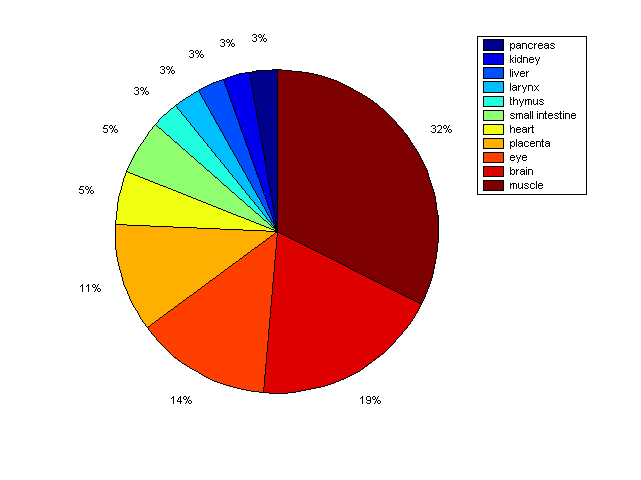
Distribution of Co-regulatory TFs
|
|
|
Description: this pie chart displays the distribution of co-regulatory transcription factors (TFs) in different tissues. Color schema: the tissue with the largest percentage of co-regulatory TFs is colored dark red whereas the tissue with the smallest percentage of co-regulatory TFs is colored dark blue. Tissues with intermediate percentages of co-regulatory TFs are colored from light red to yellow and cyan and then to light blue. |