Summary Table (Download Table)
| Co-regulatory TF | Tissue | -log(P) |
  | | |
| TGIF | brain | 6.27499 |
| TFII-I | thymus | 8.02603 |
| TAX/CREB | thymus | 6.9128 |
| TATA | bone | 7.349 |
| TAL-1BETA/ITF-2 | muscle | 6.27332 |
| TAL-1BETA/ITF-2 | brain | 7.30912 |
| STAT3 | mammary_gland | 7.22699 |
| SRF | soft_tissue | 7.18248 |
| SRF | muscle | 9.45992 |
| SREBP-1 | thymus | 6.59989 |
| SMAD-4 | brain | 6.97379 |
| SMAD-3 | thymus | 8.47343 |
| RSRFC4 | muscle | 8.30485 |
| RREB-1 | thymus | 11.0755 |
| RB/E2F-1/DP-1 | thymus | 8.13113 |
| PU.1 | thymus | 10.0352 |
| PPARG | skin | 6.95714 |
| OCT-1 | brain | 6.4888 |
| NRSF | skin | 6.72824 |
| NRF-1 | thymus | 8.5543 |
| NRF-1 | larynx | 6.44421 |
| NF-Y | thymus | 8.92178 |
| NF-MUE1 | larynx | 7.30536 |
| NF-KAPPAB_(P65) | soft_tissue | 8.5495 |
| NF-KAPPAB_(P65) | larynx | 7.27386 |
| NF-KAPPAB | soft_tissue | 6.53877 |
| NF-E2 | tongue | 6.72328 |
| NF-1 | brain | 6.97974 |
| MZF1 | thymus | 9.86809 |
| MYOD | thymus | 8.18509 |
| MEF-2 | muscle | 10.0182 |
| MEF-2 | heart | 7.5533 |
| MAZ | thymus | 9.8088 |
| LHX3 | soft_tissue | 6.4481 |
| LBP-1 | thymus | 10.3192 |
| LBP-1 | spleen | 10.2377 |
| LBP-1 | brain | 8.03819 |
| HNF-3ALPHA | soft_tissue | 6.44056 |
| HNF-1 | kidney | 9.86223 |
| HEB | larynx | 7.20654 |
| GATA-X | skin | 6.23781 |
| FOXO4 | soft_tissue | 7.04503 |
| FOXJ2 | eye | 7.64769 |
| ETF | mammary_gland | 14.5174 |
| ETF | larynx | 9.88676 |
| E4F1 | thymus | 6.33583 |
| E2F-4/DP-1 | thymus | 8.69252 |
| E2F-1 | thymus | 9.24046 |
| E2F-1 | soft_tissue | 7.47692 |
| E2F | thymus | 10.6281 |
| E12 | thymus | 8.72267 |
| E12 | pancreas | 7.38759 |
| DBP | thymus | 6.4678 |
| CREB | thymus | 9.21009 |
| CREB | kidney | 7.16764 |
| CRE-BP1 | thymus | 9.59345 |
| CRE-BP1 | kidney | 7.13135 |
| CACCC-BINDING_FACTOR | thymus | 7.45762 |
| C-REL | soft_tissue | 7.80201 |
| C-MYC/MAX | thymus | 9.33242 |
| C-MYC/MAX | small_intestine | 6.39195 |
| C-MYB | larynx | 8.64387 |
| BSAP | thymus | 8.04617 |
| ATF-1 | thymus | 8.26946 |
| ATF-1 | pancreas | 7.95147 |
| ATF | thymus | 17.4933 |
| ATF | kidney | 9.41358 |
| AP-4 | thymus | 6.99001 |
| AP-4 | brain | 8.31178 |
| AP-1 | tongue | 7.29416 |
| ALPHA-CP1 | small_intestine | 6.29725 |
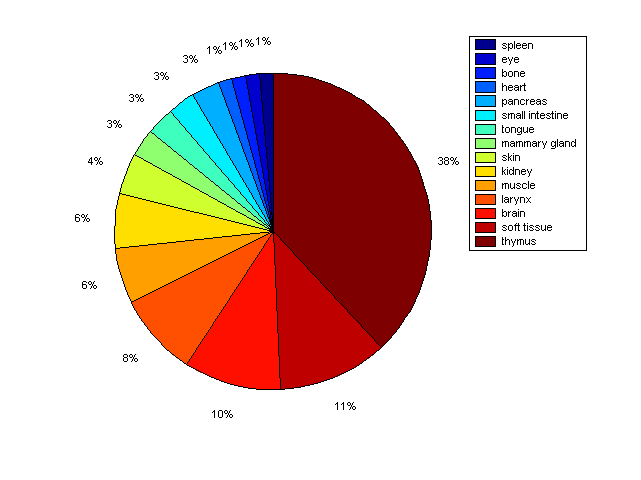
Distribution of Co-regulatory TFs
|
|
|
Description: this pie chart displays the distribution of co-regulatory transcription factors (TFs) in different tissues. Color schema: the tissue with the largest percentage of co-regulatory TFs is colored dark red whereas the tissue with the smallest percentage of co-regulatory TFs is colored dark blue. Tissues with intermediate percentages of co-regulatory TFs are colored from light red to yellow and cyan and then to light blue. |