Summary Table (Download Table)
| Co-regulatory TF | Tissue | -log(P) |
  | | |
| TST-1 | ovary | 7.79639 |
| TFII-I | thymus | 6.51658 |
| TAX/CREB | thymus | 9.86809 |
| TATA | lung | 6.86731 |
| TAL-1ALPHA/E47 | muscle | 6.31848 |
| STAT1 | brain | 9.59656 |
| SRY | brain | 9.52379 |
| SRF | heart | 11.2354 |
| SREBP-1 | testis | 7.2421 |
| SREBP-1 | ovary | 7.80357 |
| SP1 | ovary | 11.7402 |
| RSRFC4 | muscle | 10.9935 |
| RREB-1 | thymus | 8.52926 |
| RREB-1 | skin | 6.44562 |
| RREB-1 | muscle | 9.20418 |
| RREB-1 | brain | 8.99698 |
| RP58 | ovary | 6.70577 |
| RFX1 | bone | 6.36954 |
| PPARG | skin | 7.12119 |
| P300 | brain | 8.99015 |
| NRF-1 | testis | 7.19644 |
| NRF-1 | small_intestine | 6.76122 |
| NF-Y | thymus | 7.6367 |
| NF-Y | brain | 6.79193 |
| NF-KAPPAB_(P50) | skin | 8.1831 |
| NF-KAPPAB_(P50) | ovary | 6.52526 |
| NF-KAPPAB | larynx | 7.76473 |
| NERF1A | bone_marrow | 6.60588 |
| MZF1 | ovary | 6.357 |
| MIF-1 | skin | 8.25358 |
| MIF-1 | colon | 8.40355 |
| MIF-1 | bone | 7.11896 |
| MEIS1B/HOXA9 | brain | 6.82588 |
| MEF-2 | muscle | 12.2912 |
| MAZR | small_intestine | 7.34769 |
| MAZ | thymus | 7.02691 |
| MAZ | small_intestine | 7.7679 |
| LUN-1 | soft_tissue | 6.79578 |
| LUN-1 | brain | 10.1654 |
| LF-A1 | bone | 6.59759 |
| LBP-1 | brain | 11.9972 |
| LBP-1 | bone | 7.41628 |
| HSF | brain | 7.54822 |
| HOXA4 | ovary | 6.72627 |
| HNF-1 | kidney | 6.21648 |
| GCNF | brain | 9.74465 |
| FREAC-7 | lung | 6.45441 |
| E4F1 | ovary | 6.65872 |
| E47 | larynx | 7.16785 |
| E2F-1 | small_intestine | 13.1973 |
| E2F | tongue | 9.22184 |
| E2F | brain | 7.98216 |
| CRX | larynx | 7.65811 |
| CRX | eye | 10.6372 |
| CREB | tongue | 7.7172 |
| CREB | ovary | 10.4433 |
| CRE-BP1 | ovary | 6.5202 |
| CHX10 | brain | 8.57172 |
| CDC5 | brain | 6.92417 |
| CART-1 | brain | 10.2879 |
| CACCC-BINDING_FACTOR | brain | 10.1129 |
| C-MYC/MAX | thymus | 6.26232 |
| C-MYC/MAX | small_intestine | 7.40863 |
| C-MYC/MAX | ovary | 7.16218 |
| C-ETS-2 | lymph_node | 6.61703 |
| BSAP | small_intestine | 7.49417 |
| ATF-1 | thymus | 6.32035 |
| ATF-1 | ovary | 7.71811 |
| ATF | tongue | 7.5227 |
| ATF | thymus | 6.95742 |
| ATF | ovary | 9.60703 |
| ARNT | skin | 6.17339 |
| AREB6 | small_intestine | 9.31862 |
| AP-4 | thymus | 6.33637 |
| AP-4 | skin | 6.697 |
| AP-4 | brain | 9.48016 |
| AP-2 | pancreas | 6.46954 |
| ALPHA-CP1 | small_intestine | 7.03184 |
| AHR/ARNT | ovary | 7.2514 |
| AHR/ARNT | brain | 6.79525 |
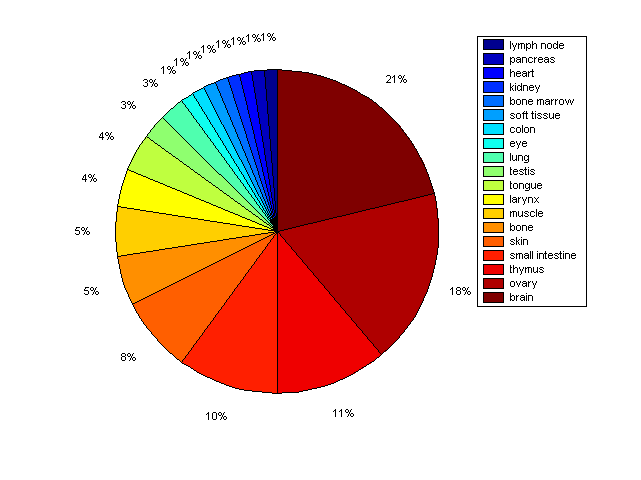
Distribution of Co-regulatory TFs
|
|
|
Description: this pie chart displays the distribution of co-regulatory transcription factors (TFs) in different tissues. Color schema: the tissue with the largest percentage of co-regulatory TFs is colored dark red whereas the tissue with the smallest percentage of co-regulatory TFs is colored dark blue. Tissues with intermediate percentages of co-regulatory TFs are colored from light red to yellow and cyan and then to light blue. |