Summary Table (Download Table)
| Co-regulatory TF | Tissue | -log(P) |
  | | |
| ZID | larynx | 6.97223 |
| TITF1 | small_intestine | 6.52052 |
| TAL-1BETA/ITF-2 | brain | 7.509 |
| STAT5A | brain | 6.27264 |
| SRY | liver | 6.56143 |
| SREBP-1 | brain | 6.42384 |
| RSRFC4 | soft_tissue | 6.20643 |
| RSRFC4 | muscle | 9.49889 |
| RREB-1 | brain | 8.10482 |
| RORALPHA1 | liver | 6.55641 |
| RFX1 | testis | 6.41253 |
| PPARG | testis | 7.69738 |
| PPARG | kidney | 9.58735 |
| PITX2 | brain | 6.45529 |
| OCT-1 | kidney | 11.0238 |
| OCT-1 | brain | 7.03117 |
| NR2E3 | kidney | 9.06489 |
| NF-MUE1 | kidney | 6.91144 |
| MIF-1 | testis | 6.53416 |
| MEIS1B/HOXA9 | small_intestine | 6.68936 |
| MEF-2 | muscle | 11.3031 |
| MAZ | brain | 7.1594 |
| LF-A1 | brain | 7.70818 |
| LBP-1 | muscle | 9.73019 |
| HNF-4ALPHA | liver | 7.24435 |
| HNF-4ALPHA | kidney | 10.3217 |
| HNF-4 | kidney | 6.42889 |
| HNF-1 | liver | 17.1069 |
| HNF-1 | kidney | 18.3688 |
| GR | liver | 6.79447 |
| GATA-X | kidney | 11.8699 |
| GATA-4 | kidney | 8.56557 |
| GATA-1 | liver | 6.31596 |
| GATA-1 | kidney | 12.0581 |
| FREAC-4 | kidney | 6.99149 |
| FOXO4 | soft_tissue | 6.47677 |
| EGR-3 | uterus | 6.26935 |
| E4BP4 | liver | 9.00027 |
| E12 | pancreas | 6.47204 |
| DBP | liver | 6.65918 |
| CRX | kidney | 10.0307 |
| COUP-TF/HNF-4 | kidney | 13.9269 |
| CHX10 | brain | 9.01329 |
| CDC5 | small_intestine | 7.02205 |
| C/EBPDELTA | colon | 7.27769 |
| C/EBPBETA | liver | 6.53284 |
| C/EBP | liver | 7.4527 |
| AREB6 | kidney | 10.5151 |
| AMEF-2 | kidney | 7.16733 |
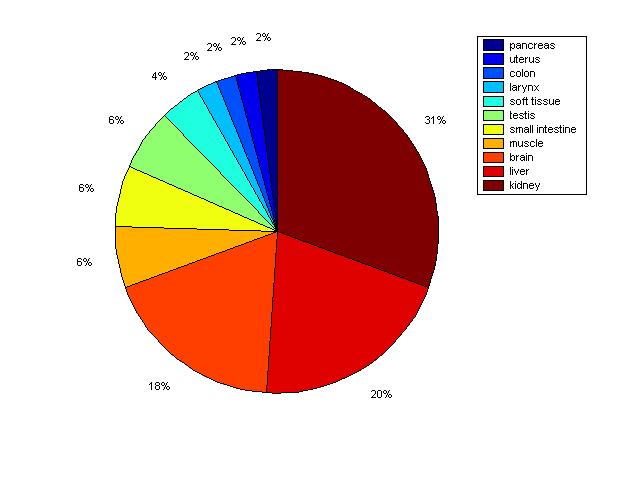
Distribution of Co-regulatory TFs
|
|
|
Description: this pie chart displays the distribution of co-regulatory transcription factors (TFs) in different tissues. Color schema: the tissue with the largest percentage of co-regulatory TFs is colored dark red whereas the tissue with the smallest percentage of co-regulatory TFs is colored dark blue. Tissues with intermediate percentages of co-regulatory TFs are colored from light red to yellow and cyan and then to light blue. |