Summary Table (Download Table)
| Co-regulatory TF | Tissue | -log(P) |
  | | |
| RREB-1 | small_intestine | 6.22115 |
| E2F-1 | thymus | 6.26626 |
| NRF-1 | lymph_node | 6.27922 |
| ALPHA-CP1 | small_intestine | 6.37268 |
| ELK-1 | cervix | 6.45074 |
| E2F-1 | testis | 6.45251 |
| MAZR | larynx | 6.49322 |
| CRE-BP1/C-JUN | tongue | 6.63767 |
| PAX-3 | small_intestine | 6.6496 |
| GR | thymus | 6.69685 |
| VDR | small_intestine | 6.75683 |
| C-MYC/MAX | cervix | 6.83114 |
| RB/E2F-1/DP-1 | soft_tissue | 6.83588 |
| STAT5A_(HOMOTETRAMER) | thymus | 6.89229 |
| GABP | testis | 6.903 |
| TATA | small_intestine | 6.93781 |
| HEB | small_intestine | 6.97968 |
| NF-Y | testis | 7.07049 |
| ETF | bladder | 7.07277 |
| E2F-1/DP-1 | bone_marrow | 7.07292 |
| CREB | tongue | 7.07863 |
| ETF | testis | 7.25557 |
| PBX-1 | brain | 7.26024 |
| STAT1 | bone_marrow | 7.31342 |
| RB/E2F-1/DP-1 | cervix | 7.4219 |
| E2F-4/DP-2 | bone_marrow | 7.45593 |
| AHR/ARNT | small_intestine | 7.48124 |
| ATF | tongue | 7.69461 |
| ETF | bone_marrow | 7.70668 |
| C/EBP | tongue | 7.75177 |
| E2F | cervix | 7.80984 |
| E2F | bone_marrow | 7.82594 |
| GR | soft_tissue | 7.99611 |
| E2F-1 | cervix | 8.19135 |
| SP1 | testis | 8.19444 |
| NF-Y | lymph_node | 8.27955 |
| NF-Y | small_intestine | 8.3623 |
| LXR | heart | 8.44502 |
| ZID | small_intestine | 8.4599 |
| ETF | brain | 8.57704 |
| ELK-1 | testis | 8.60021 |
| NRF-1 | bone_marrow | 8.64076 |
| TAX/CREB | thymus | 8.69252 |
| E2F | larynx | 8.85839 |
| GCM | brain | 8.90385 |
| NRF-1 | tongue | 8.93796 |
| E2F-1/DP-2 | bone_marrow | 9.12265 |
| SMAD-4 | brain | 9.36224 |
| ETF | blood | 9.38263 |
| NRF-1 | liver | 9.75659 |
| ATF | bone | 9.79517 |
| NRF-1 | testis | 10.326 |
| MAZR | tongue | 10.3939 |
| HMG_IY | small_intestine | 10.398 |
| SP1 | tongue | 10.5081 |
| SRF | small_intestine | 10.7557 |
| NERF1A | small_intestine | 10.8429 |
| NRF-1 | blood | 11.4935 |
| NRF-1 | bladder | 12.9863 |
| ELK-1 | small_intestine | 16.8687 |
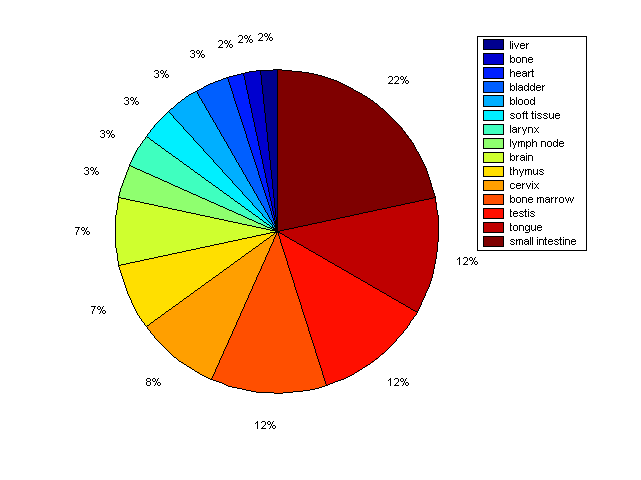
Distribution of Co-regulatory TFs
|
|
|
Description: this pie chart displays the distribution of co-regulatory transcription factors (TFs) in different tissues. Color schema: the tissue with the largest percentage of co-regulatory TFs is colored dark red whereas the tissue with the smallest percentage of co-regulatory TFs is colored dark blue. Tissues with intermediate percentages of co-regulatory TFs are colored from light red to yellow and cyan and then to light blue. |