Summary Table (Download Table)
| Co-regulatory TF | Tissue | -log(P) |
  | | |
| AP-3 | heart | 13.8127 |
| C/EBPBETA | heart | 6.54654 |
| C/EBPDELTA | prostate | 6.18354 |
| CDC5 | kidney | 8.31286 |
| CDP | brain | 6.33709 |
| FOXJ2 | kidney | 12.1664 |
| FREAC-3 | heart | 7.14661 |
| GATA-1 | kidney | 8.20255 |
| GATA-6 | heart | 6.77255 |
| HLF | bone | 6.72215 |
| HNF-1 | bone | 7.3675 |
| HNF-4 | small_intestine | 7.02205 |
| HNF-6 | kidney | 11.743 |
| ICSBP | heart | 6.97603 |
| IRF1 | heart | 8.62644 |
| ISRE | brain | 7.10556 |
| LHX3 | prostate | 7.5997 |
| MEF-2 | brain | 7.68651 |
| MEF-2 | heart | 8.7985 |
| MZF1 | brain | 6.92417 |
| NF-E2 | heart | 6.23661 |
| NF-Y | brain | 7.56986 |
| NKX6-1 | heart | 6.73541 |
| NKX6-2 | prostate | 6.61526 |
| OCT-1 | bone | 11.0817 |
| OCT-1 | heart | 8.02599 |
| PEA3 | bone_marrow | 7.43729 |
| POU3F2 | lymph_node | 7.45742 |
| POU3F2 | testis | 9.60538 |
| RORALPHA2 | brain | 6.60198 |
| RREB-1 | heart | 9.05083 |
| SP1 | brain | 6.31319 |
| SRF | muscle | 6.66624 |
| SRY | brain | 12.282 |
| STAT5A | brain | 9.40926 |
| STAT5A | muscle | 6.20834 |
| TATA | kidney | 7.73381 |
| TBP | prostate | 9.61015 |
| TEF | heart | 6.77514 |
| TITF1 | small_intestine | 7.16474 |
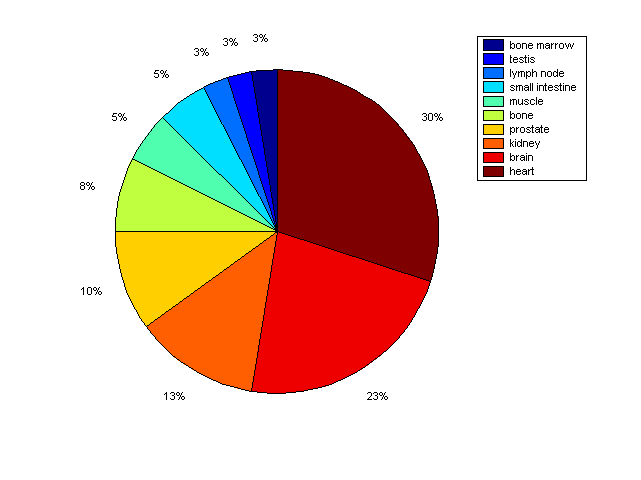
Distribution of Co-regulatory TFs
|
|
|
Description: this pie chart displays the distribution of co-regulatory transcription factors (TFs) in different tissues. Color schema: the tissue with the largest percentage of co-regulatory TFs is colored dark red whereas the tissue with the smallest percentage of co-regulatory TFs is colored dark blue. Tissues with intermediate percentages of co-regulatory TFs are colored from light red to yellow and cyan and then to light blue. |