Summary Table (Download Table)
| Co-regulatory TF | Tissue | -log(P) |
  | | |
| SREBP-1 | thymus | 6.35566 |
| IRF-1 | thymus | 7.1175 |
| GCNF | testis | 6.49573 |
| HAND1/E47 | soft_tissue | 7.9706 |
| NRSF | small_intestine | 7.06053 |
| GATA-4 | small_intestine | 9.20053 |
| COUP-TF/HNF-4 | small_intestine | 7.91492 |
| LHX3 | placenta | 8.98988 |
| ATF | placenta | 8.126 |
| NF-Y | peripheral_nervous_system | 7.29833 |
| MYOD | peripheral_nervous_system | 6.51466 |
| CREB | peripheral_nervous_system | 10.6655 |
| ATF3 | peripheral_nervous_system | 6.78962 |
| SREBP-1 | muscle | 9.28217 |
| LBP-1 | muscle | 7.22289 |
| GR | muscle | 11.7516 |
| E47 | muscle | 6.32399 |
| AP-1 | muscle | 7.1013 |
| C/EBPDELTA | liver | 8.1549 |
| TAL-1BETA/ITF-2 | larynx | 7.63068 |
| RREB-1 | larynx | 6.87232 |
| MEF-2 | larynx | 6.87561 |
| GR | larynx | 8.77233 |
| E2F | larynx | 7.45978 |
| HNF-1 | kidney | 11.6387 |
| TATA | heart | 10.1295 |
| GATA-X | heart | 7.13055 |
| C/EBP | heart | 6.881 |
| RREB-1 | brain | 8.36467 |
| LF-A1 | brain | 11.448 |
| ATF-1 | brain | 9.72062 |
| ELK-1 | blood | 11.5751 |
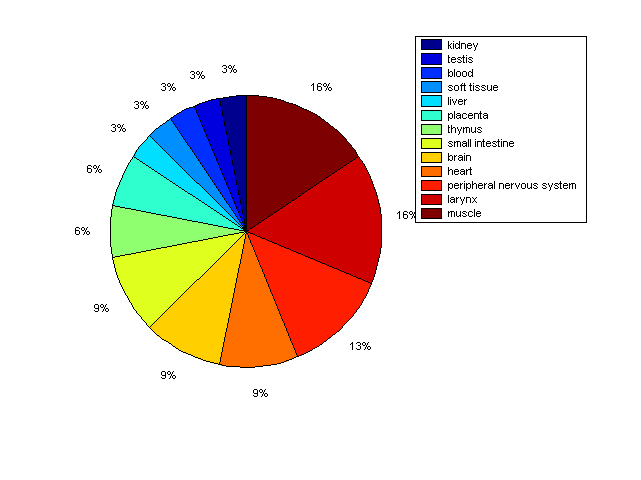
Distribution of Co-regulatory TFs
|
|
|
Description: this pie chart displays the distribution of co-regulatory transcription factors (TFs) in different tissues. Color schema: the tissue with the largest percentage of co-regulatory TFs is colored dark red whereas the tissue with the smallest percentage of co-regulatory TFs is colored dark blue. Tissues with intermediate percentages of co-regulatory TFs are colored from light red to yellow and cyan and then to light blue. |