Summary Table (Download Table)
| Co-regulatory TF | Tissue | -log(P) |
  | | |
| AML-1A | blood | 6.76697 |
| AML1 | blood | 6.76697 |
| AP-1 | blood | 6.5591 |
| C-ETS-1 | blood | 10.2657 |
| C-ETS-2 | blood | 6.75415 |
| C/EBPGAMMA | blood | 9.13346 |
| ELK-1 | blood | 8.60046 |
| FOXO1 | blood | 7.23401 |
| NERF1A | blood | 6.88295 |
| PEA3 | blood | 7.17001 |
| STAT3 | blood | 8.18324 |
| EF-C | bone | 8.48719 |
| HMG_IY | bone | 6.65446 |
| OCT-1 | bone | 10.0458 |
| PAX-8 | bone | 6.26966 |
| RFX1 | bone | 6.48193 |
| RSRFC4 | bone | 8.09599 |
| ELK-1 | bone_marrow | 9.05566 |
| FOXD3 | bone_marrow | 7.55972 |
| FOXJ2 | bone_marrow | 7.73291 |
| AREB6 | brain | 6.73015 |
| C/EBPBETA | brain | 6.60756 |
| E12 | brain | 7.39394 |
| RFX1 | brain | 9.85635 |
| ATF | eye | 6.68102 |
| TITF1 | eye | 6.41105 |
| E4BP4 | kidney | 9.84521 |
| FREAC-2 | kidney | 6.78484 |
| ELK-1 | larynx | 6.95793 |
| MEF-2 | muscle | 8.11269 |
| PAX-8 | muscle | 7.68905 |
| RSRFC4 | muscle | 8.69479 |
| SMAD-4 | skin | 6.33284 |
| C/EBPDELTA | soft_tissue | 6.80665 |
| CDP | soft_tissue | 6.74815 |
| TCF11 | soft_tissue | 8.19512 |
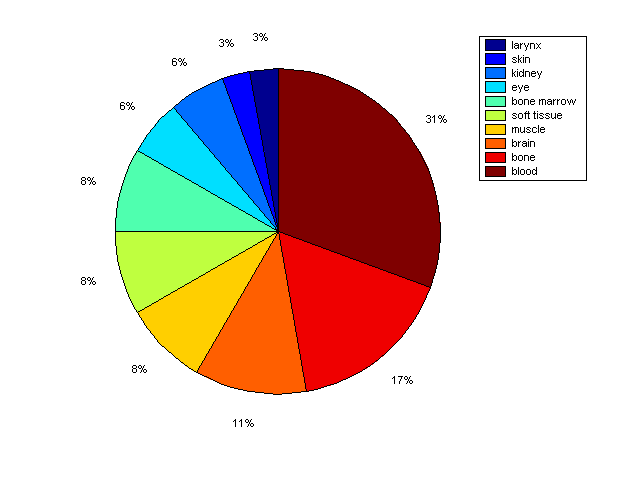
Distribution of Co-regulatory TFs
|
|
|
Description: this pie chart displays the distribution of co-regulatory transcription factors (TFs) in different tissues. Color schema: the tissue with the largest percentage of co-regulatory TFs is colored dark red whereas the tissue with the smallest percentage of co-regulatory TFs is colored dark blue. Tissues with intermediate percentages of co-regulatory TFs are colored from light red to yellow and cyan and then to light blue. |