Summary Table (Download Table)
| Co-regulatory TF | Tissue | -log(P) |
  | | |
| NF-KAPPAB_(P50) | tongue | 8.10137 |
| NF-KAPPAB | tongue | 7.09198 |
| C-MYC/MAX | tongue | 8.00453 |
| BACH1 | tongue | 9.04888 |
| TBP | stomach | 7.44639 |
| HNF-3ALPHA | soft_tissue | 7.56108 |
| HNF-1 | ovary | 6.72474 |
| ETF | ovary | 6.40494 |
| RSRFC4 | muscle | 10.6385 |
| MEF-2 | muscle | 12.2967 |
| RP58 | liver | 6.20728 |
| HNF-1 | liver | 7.45405 |
| GATA-6 | liver | 7.31563 |
| C/EBPDELTA | liver | 7.65913 |
| C/EBPBETA | liver | 6.8881 |
| SRF | larynx | 10.8134 |
| HNF-1 | kidney | 10.6536 |
| CRX | kidney | 6.75061 |
| TCF11/MAFG | heart | 6.39253 |
| STAT4 | heart | 8.42028 |
| ICSBP | heart | 6.29072 |
| HNF-3ALPHA | heart | 7.61186 |
| GATA-X | heart | 6.7543 |
| GATA-6 | heart | 6.17868 |
| GATA-1 | heart | 6.18204 |
| FREAC-2 | heart | 6.20791 |
| C/EBPBETA | heart | 6.56962 |
| C/EBP | heart | 6.66998 |
| PITX2 | eye | 8.9686 |
| FOXJ2 | eye | 6.34719 |
| CRX | eye | 12.8655 |
| CHX10 | eye | 11.6646 |
| FREAC-3 | brain | 6.23361 |
| OCT-1 | bone | 6.35942 |
| PEA3 | blood | 6.29979 |
| MEF-2 | blood | 6.79103 |
| FOXJ2 | blood | 6.48548 |
| AFP1 | blood | 8.36242 |
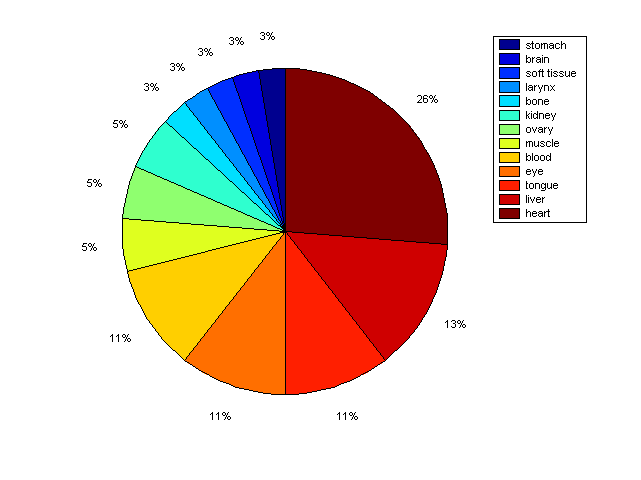
Distribution of Co-regulatory TFs
|
|
|
Description: this pie chart displays the distribution of co-regulatory transcription factors (TFs) in different tissues. Color schema: the tissue with the largest percentage of co-regulatory TFs is colored dark red whereas the tissue with the smallest percentage of co-regulatory TFs is colored dark blue. Tissues with intermediate percentages of co-regulatory TFs are colored from light red to yellow and cyan and then to light blue. |