Summary Table (Download Table)
| Co-regulatory TF | Tissue | -log(P) |
  | | |
| NKX6-2 | thymus | 6.29073 |
| NR2E3 | testis | 6.39698 |
| AREB6 | spleen | 6.94912 |
| RREB-1 | small_intestine | 7.23697 |
| FREAC-7 | placenta | 6.5786 |
| TBP | peripheral_nervous_system | 6.25935 |
| PPAR | peripheral_nervous_system | 6.64617 |
| POU3F2 | peripheral_nervous_system | 6.78132 |
| MRF-2 | peripheral_nervous_system | 7.19883 |
| HFH-4 | peripheral_nervous_system | 6.18632 |
| ATF-1 | pancreas | 7.1948 |
| ATF | pancreas | 7.18698 |
| HFH-3 | ovary | 6.2527 |
| TAL-1BETA/ITF-2 | muscle | 7.29272 |
| AP-4 | muscle | 6.22248 |
| AML1 | muscle | 8.29892 |
| AML-1A | muscle | 8.29892 |
| ELK-1 | mammary_gland | 6.66273 |
| OCT-1 | liver | 7.18837 |
| TCF11 | larynx | 6.3434 |
| C-MYC/MAX | larynx | 8.40619 |
| ATF6 | larynx | 6.69549 |
| SRF | kidney | 8.61199 |
| PPARG | kidney | 6.45322 |
| GATA-1 | kidney | 7.36854 |
| TST-1 | heart | 11.5855 |
| RREB-1 | heart | 6.58333 |
| PITX2 | heart | 11.0703 |
| MEF-2 | heart | 13.1419 |
| GATA-6 | heart | 11.0125 |
| GATA-1 | heart | 10.1672 |
| FXR | heart | 8.42028 |
| FOXJ2 | heart | 6.61576 |
| C/EBP | heart | 6.47791 |
| OCT-1 | eye | 6.24919 |
| NKX3A | eye | 9.53309 |
| LMO2_COMPLEX | eye | 6.29032 |
| AML1 | colon | 7.04058 |
| AML-1A | colon | 7.04058 |
| C/EBP | brain | 13.5795 |
| AP-3 | bone | 8.20293 |
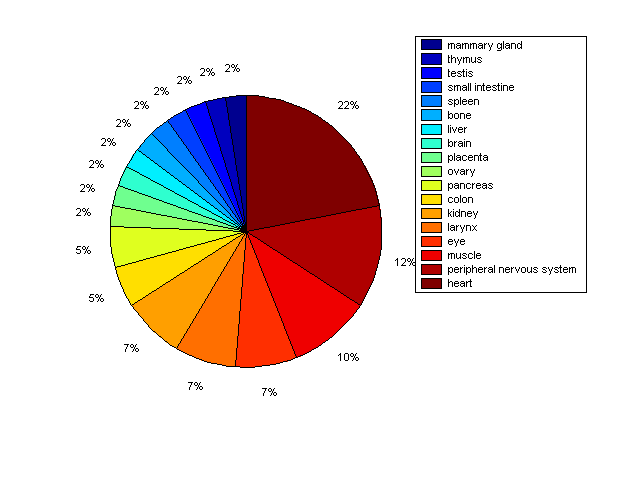
Distribution of Co-regulatory TFs
|
|
|
Description: this pie chart displays the distribution of co-regulatory transcription factors (TFs) in different tissues. Color schema: the tissue with the largest percentage of co-regulatory TFs is colored dark red whereas the tissue with the smallest percentage of co-regulatory TFs is colored dark blue. Tissues with intermediate percentages of co-regulatory TFs are colored from light red to yellow and cyan and then to light blue. |