Summary Table (Download Table)
| Co-regulatory TF | Tissue | -log(P) |
  | | |
| RREB-1 | small_intestine | 6.24907 |
| HSF | peripheral_nervous_system | 6.25715 |
| COUP-TF/HNF-4 | kidney | 6.29935 |
| CREB | brain | 6.34042 |
| NERF1A | soft_tissue | 6.35051 |
| CREB | peripheral_nervous_system | 6.41739 |
| RFX1 | brain | 6.55839 |
| OCT-1 | eye | 6.56496 |
| DBP | soft_tissue | 6.59892 |
| SF-1 | muscle | 6.74444 |
| AFP1 | small_intestine | 6.80082 |
| GATA-6 | blood | 6.81639 |
| MAZR | brain | 6.90933 |
| NR2E3 | kidney | 7.04344 |
| TAL-1ALPHA/E47 | muscle | 7.11008 |
| RREB-1 | muscle | 7.2266 |
| HNF-4ALPHA | kidney | 7.28424 |
| HNF-6 | eye | 7.37624 |
| YY1 | brain | 7.41511 |
| GATA-1 | eye | 7.70954 |
| ATF | brain | 7.75221 |
| TAL-1BETA/ITF-2 | muscle | 7.76363 |
| HSF | soft_tissue | 7.92037 |
| CRX | eye | 8.2299 |
| TAL-1BETA/E47 | muscle | 8.56415 |
| LUN-1 | soft_tissue | 9.03312 |
| SREBP-1 | cervix | 9.34022 |
| ALX-4 | soft_tissue | 12.6609 |
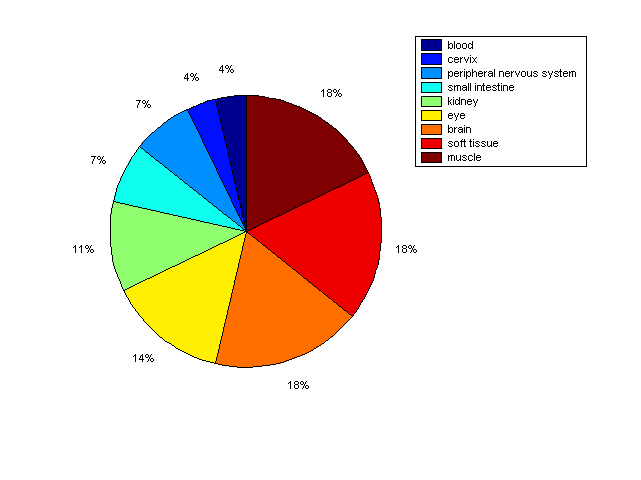
Distribution of Co-regulatory TFs
|
|
|
Description: this pie chart displays the distribution of co-regulatory transcription factors (TFs) in different tissues. Color schema: the tissue with the largest percentage of co-regulatory TFs is colored dark red whereas the tissue with the smallest percentage of co-regulatory TFs is colored dark blue. Tissues with intermediate percentages of co-regulatory TFs are colored from light red to yellow and cyan and then to light blue. |