Summary Table (Download Table)
| Co-regulatory TF | Tissue | -log(P) |
  | | |
| MIF-1 | bone | 8.10898 |
| NKX3A | bone_marrow | 7.38368 |
| FAC1 | brain | 6.65712 |
| TFII-I | brain | 6.66608 |
| HNF-1 | cervix | 6.90144 |
| E2F | heart | 7.58039 |
| E2F-4/DP-1 | heart | 8.44502 |
| ICSBP | heart | 7.4498 |
| BSAP | larynx | 6.74791 |
| ETF | larynx | 12.0852 |
| FOXO3 | liver | 6.49884 |
| MEF-2 | muscle | 6.46353 |
| MEIS1 | muscle | 10.3722 |
| TAL-1ALPHA/E47 | muscle | 9.35083 |
| TATA | muscle | 7.2788 |
| TGIF | muscle | 8.4701 |
| FREAC-7 | ovary | 8.14706 |
| GATA-1 | ovary | 6.73567 |
| LUN-1 | ovary | 8.19091 |
| NF-KAPPAB | ovary | 6.43376 |
| VDR | ovary | 15.0086 |
| ZIC2 | ovary | 6.6059 |
| RFX1 | pancreas | 6.20037 |
| AHR/ARNT | small_intestine | 6.33154 |
| AP-4 | small_intestine | 7.37627 |
| C-MYC/MAX | small_intestine | 9.07536 |
| LBP-1 | small_intestine | 6.60596 |
| RREB-1 | small_intestine | 7.59335 |
| USF | small_intestine | 6.52616 |
| SMAD-4 | testis | 6.54426 |
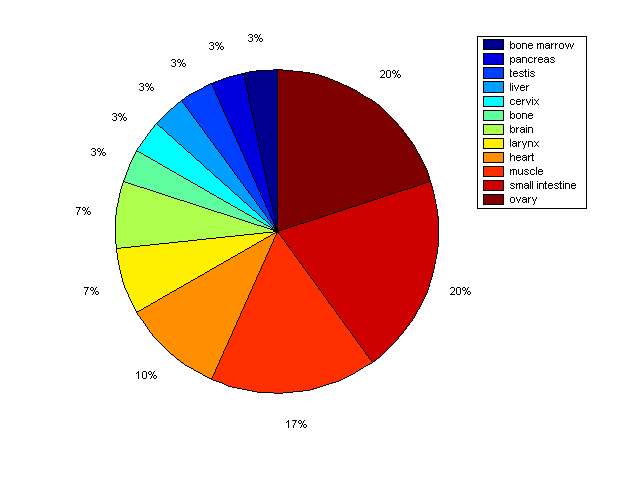
Distribution of Co-regulatory TFs
|
|
|
Description: this pie chart displays the distribution of co-regulatory transcription factors (TFs) in different tissues. Color schema: the tissue with the largest percentage of co-regulatory TFs is colored dark red whereas the tissue with the smallest percentage of co-regulatory TFs is colored dark blue. Tissues with intermediate percentages of co-regulatory TFs are colored from light red to yellow and cyan and then to light blue. |