Summary Table (Download Table)
| Co-regulatory TF | Tissue | -log(P) |
  | | |
| AP-3 | heart | 8.27119 |
| C/EBP | bone | 6.77251 |
| C/EBP | liver | 8.18962 |
| C/EBPBETA | placenta | 7.61575 |
| CDP | brain | 6.98435 |
| CDP | muscle | 13.9631 |
| CDP_CR3 | brain | 6.87612 |
| CHX10 | brain | 7.07586 |
| COUP-TF/HNF-4 | liver | 8.33661 |
| DBP | thymus | 6.57339 |
| FOXJ2 | muscle | 6.16611 |
| FREAC-2 | brain | 7.68849 |
| GR | bone_marrow | 7.37841 |
| HNF-1 | kidney | 10.567 |
| HNF-1 | liver | 13.6637 |
| HNF-1 | spleen | 7.23965 |
| HNF-3ALPHA | brain | 8.67948 |
| HNF-6 | brain | 6.24982 |
| HSF2 | eye | 6.47626 |
| IRF-1 | small_intestine | 7.61037 |
| LHX3 | prostate | 6.28835 |
| MEF-2 | brain | 6.65161 |
| MIF-1 | brain | 7.51248 |
| NKX3A | kidney | 7.69542 |
| OCT-1 | bone | 6.72046 |
| POU3F2 | peripheral_nervous_system | 6.89989 |
| SRF | prostate | 7.94899 |
| SRY | peripheral_nervous_system | 6.37026 |
| SRY | small_intestine | 7.3231 |
| STAT5A | eye | 6.22598 |
| TATA | heart | 9.3534 |
| TATA | small_intestine | 7.95031 |
| TST-1 | brain | 11.5511 |
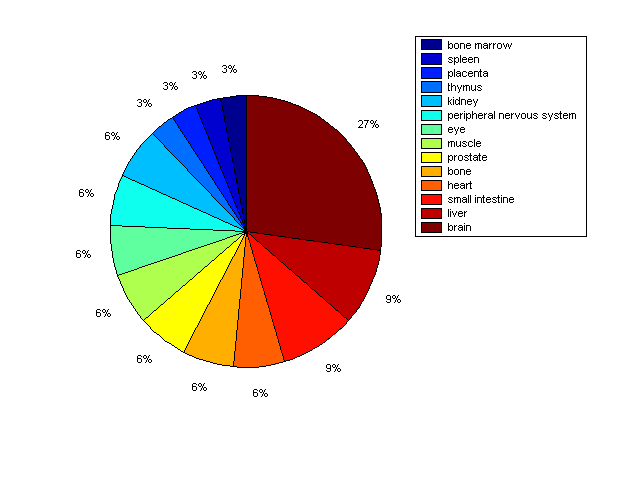
Distribution of Co-regulatory TFs
|
|
|
Description: this pie chart displays the distribution of co-regulatory transcription factors (TFs) in different tissues. Color schema: the tissue with the largest percentage of co-regulatory TFs is colored dark red whereas the tissue with the smallest percentage of co-regulatory TFs is colored dark blue. Tissues with intermediate percentages of co-regulatory TFs are colored from light red to yellow and cyan and then to light blue. |