Summary Table (Download Table)
| Co-regulatory TF | Tissue | -log(P) |
  | | |
| P53 | blood | 6.78903 |
| TEL-2 | blood | 6.76318 |
| FOXJ2 | eye | 9.68177 |
| TAL-1ALPHA/E47 | eye | 7.34814 |
| SRF | heart | 10.1479 |
| ETF | larynx | 6.96004 |
| NF-KAPPAB | larynx | 6.16358 |
| SREBP-1 | larynx | 6.46433 |
| VDR | larynx | 6.62128 |
| C-ETS-2 | lymph_node | 6.55194 |
| CHOP-C/EBPALPHA | muscle | 6.30442 |
| HEB | muscle | 6.60146 |
| HSF1 | muscle | 6.43599 |
| LBP-1 | muscle | 8.64622 |
| MAZ | muscle | 6.16702 |
| MEF-2 | muscle | 10.0313 |
| RREB-1 | muscle | 9.46249 |
| TAL-1ALPHA/E47 | muscle | 8.21818 |
| TAL-1BETA/E47 | muscle | 7.51719 |
| TAL-1BETA/ITF-2 | muscle | 6.26824 |
| TITF1 | muscle | 7.36031 |
| ATF-1 | pancreas | 7.72406 |
| GATA-1 | pancreas | 6.76899 |
| LHX3 | pancreas | 7.68188 |
| NF-MUE1 | pancreas | 6.84814 |
| ATF | placenta | 8.67099 |
| ATF-1 | placenta | 7.25589 |
| GCM | skin | 10.6853 |
| C-REL | soft_tissue | 6.46537 |
| NF-KAPPAB_(P65) | soft_tissue | 6.21059 |
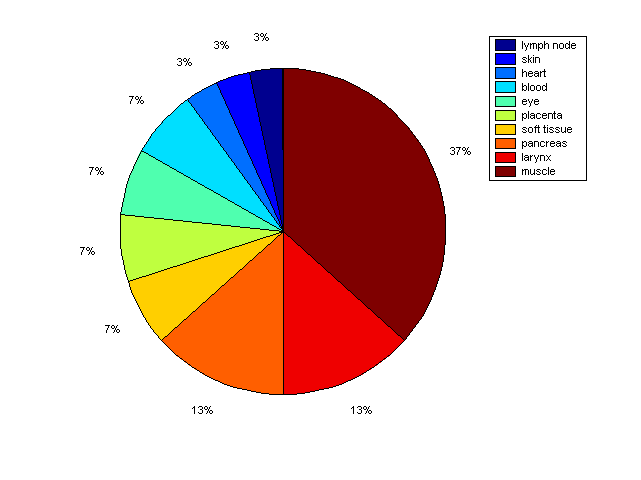
Distribution of Co-regulatory TFs
|
|
|
Description: this pie chart displays the distribution of co-regulatory transcription factors (TFs) in different tissues. Color schema: the tissue with the largest percentage of co-regulatory TFs is colored dark red whereas the tissue with the smallest percentage of co-regulatory TFs is colored dark blue. Tissues with intermediate percentages of co-regulatory TFs are colored from light red to yellow and cyan and then to light blue. |