Summary Table (Download Table)
| Co-regulatory TF | Tissue | -log(P) |
  | | |
| TEF-1 | bone | 6.44723 |
| TEF | soft_tissue | 7.23124 |
| TCF11 | soft_tissue | 6.66444 |
| TBP | soft_tissue | 6.24525 |
| STAT4 | bone | 8.20293 |
| SRY | bone_marrow | 10.9339 |
| RREB-1 | soft_tissue | 11.9971 |
| RREB-1 | peripheral_nervous_system | 10.2665 |
| RP58 | skin | 6.64618 |
| PBX-1 | brain | 6.48975 |
| PAX-8 | kidney | 6.25453 |
| OCT-X | heart | 6.81722 |
| OCT-1 | soft_tissue | 7.60612 |
| OCT-1 | heart | 7.11744 |
| NKX6-2 | eye | 6.87869 |
| NF-Y | peripheral_nervous_system | 6.23723 |
| MEF-2 | heart | 6.31835 |
| ISRE | bone | 6.60573 |
| HNF-4ALPHA | kidney | 8.59271 |
| HNF-4ALPHA | heart | 7.8826 |
| HNF-1 | colon | 8.24877 |
| FOXJ2 | bone | 16.5794 |
| ERR_ALPHA | heart | 6.46345 |
| ER | skin | 7.37869 |
| ELF-1 | bone | 6.44432 |
| CREB | peripheral_nervous_system | 6.51354 |
| CRE-BP1/C-JUN | peripheral_nervous_system | 6.3558 |
| COUP-TF/HNF-4 | kidney | 8.06739 |
| COUP-TF/HNF-4 | heart | 9.88625 |
| CHX10 | eye | 15.0943 |
| CHOP-C/EBPALPHA | brain | 12.0397 |
| CDC5 | heart | 13.8127 |
| CACCC-BINDING_FACTOR | brain | 7.13714 |
| C/EBPALPHA | heart | 8.27119 |
| C/EBP | bone | 10.8194 |
| C-ETS-2 | soft_tissue | 8.18391 |
| C-ETS-1 | soft_tissue | 6.70768 |
| BACH1 | muscle | 6.51353 |
| ATF-1 | peripheral_nervous_system | 8.64923 |
| ATF | peripheral_nervous_system | 6.26756 |
| ATF | bone | 7.5276 |
| ARP-1 | heart | 6.91535 |
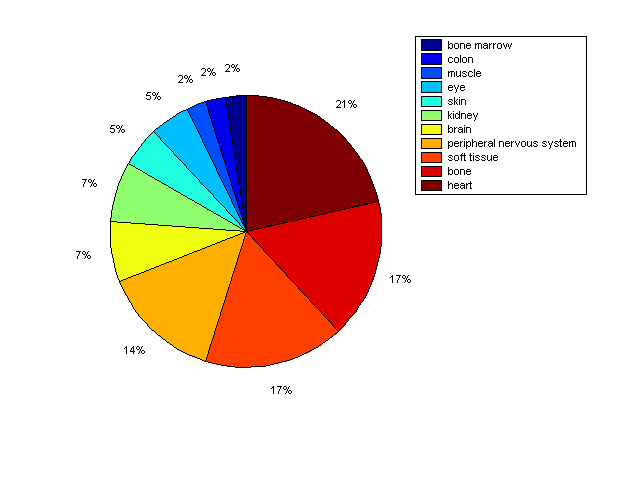
Distribution of Co-regulatory TFs
|
|
|
Description: this pie chart displays the distribution of co-regulatory transcription factors (TFs) in different tissues. Color schema: the tissue with the largest percentage of co-regulatory TFs is colored dark red whereas the tissue with the smallest percentage of co-regulatory TFs is colored dark blue. Tissues with intermediate percentages of co-regulatory TFs are colored from light red to yellow and cyan and then to light blue. |