Summary Table (Download Table)
| Co-regulatory TF | Tissue | -log(P) |
  | | |
| POU3F2 | uterus | 9.92331 |
| POU1F1 | uterus | 8.95362 |
| PAX-6 | uterus | 7.01333 |
| OCT-1 | uterus | 8.45659 |
| E4BP4 | uterus | 10.7348 |
| TCF11/MAFG | thymus | 8.7419 |
| POU3F2 | thymus | 6.5129 |
| NKX6-2 | thymus | 6.34935 |
| PAX-6 | small_intestine | 7.72188 |
| COUP-TF/HNF-4 | small_intestine | 6.3299 |
| YY1 | peripheral_nervous_system | 7.73785 |
| TEF-1 | peripheral_nervous_system | 7.9321 |
| NF-Y | peripheral_nervous_system | 8.86188 |
| FAC1 | peripheral_nervous_system | 7.78074 |
| C-ETS-1 | peripheral_nervous_system | 7.3495 |
| MAZ | ovary | 6.96193 |
| HNF-1 | kidney | 14.707 |
| COUP-TF/HNF-4 | kidney | 7.00917 |
| TCF11/MAFG | heart | 7.82951 |
| POU3F2 | heart | 7.30674 |
| PITX2 | heart | 11.4494 |
| OCT-1 | heart | 7.6299 |
| CDC5 | heart | 6.73541 |
| C/EBPBETA | heart | 6.71561 |
| C/EBP | heart | 7.7643 |
| PBX-1 | eye | 6.70734 |
| TATA | colon | 7.22488 |
| HNF-1 | colon | 10.4401 |
| FREAC-3 | colon | 9.20887 |
| CDP | colon | 11.6957 |
| ALX-4 | colon | 6.89744 |
| AFP1 | colon | 8.96915 |
| TBP | brain | 11.3523 |
| RFX1 | brain | 8.01146 |
| HMG_IY | brain | 9.4558 |
| HLF | brain | 8.35941 |
| TEF | bone_marrow | 6.23327 |
| POU3F2 | bone_marrow | 6.91493 |
| OCT-1 | bone | 6.81861 |
| NR2E3 | bone | 6.30725 |
| C/EBP | bone | 7.73324 |
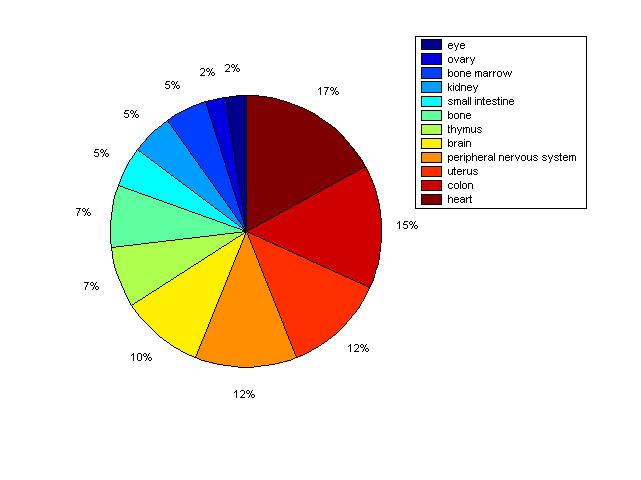
Distribution of Co-regulatory TFs
|
|
|
Description: this pie chart displays the distribution of co-regulatory transcription factors (TFs) in different tissues. Color schema: the tissue with the largest percentage of co-regulatory TFs is colored dark red whereas the tissue with the smallest percentage of co-regulatory TFs is colored dark blue. Tissues with intermediate percentages of co-regulatory TFs are colored from light red to yellow and cyan and then to light blue. |