Summary Table (Download Table)
| Co-regulatory TF | Tissue | -log(P) |
  | | |
| TEF-1 | bone | 7.95678 |
| SRF | muscle | 7.67081 |
| RREB-1 | brain | 6.79017 |
| RFX1 | bone | 24.5831 |
| NRSF | brain | 7.2926 |
| MIF-1 | bone | 32.5621 |
| MAZR | brain | 7.26187 |
| MAZ | brain | 17.2433 |
| LBP-1 | spleen | 7.4698 |
| GATA-6 | heart | 6.6345 |
| GATA-3 | brain | 6.68149 |
| GATA-1 | pancreas | 6.79679 |
| EF-C | bone | 26.7049 |
| E47 | pancreas | 8.57938 |
| E2F | tongue | 8.6505 |
| ARP-1 | brain | 7.24817 |
| ALPHA-CP1 | small_intestine | 6.53606 |
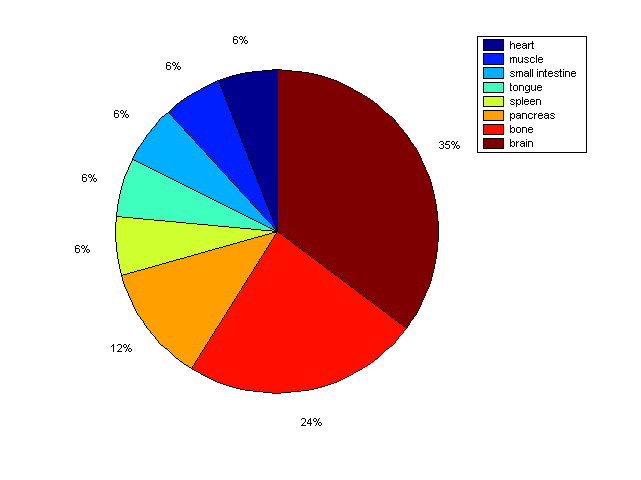
Distribution of Co-regulatory TFs
|
|
|
Description: this pie chart displays the distribution of co-regulatory transcription factors (TFs) in different tissues. Color schema: the tissue with the largest percentage of co-regulatory TFs is colored dark red whereas the tissue with the smallest percentage of co-regulatory TFs is colored dark blue. Tissues with intermediate percentages of co-regulatory TFs are colored from light red to yellow and cyan and then to light blue. |