Summary Table (Download Table)
| Co-regulatory TF | Tissue | -log(P) |
  | | |
| PPARG | testis | 7.43802 |
| NRF-1 | testis | 9.43769 |
| MIF-1 | skin | 6.98696 |
| TATA | placenta | 6.43122 |
| P53 | peripheral_nervous_system | 12.0598 |
| LF-A1 | peripheral_nervous_system | 15.8026 |
| RSRFC4 | muscle | 12.489 |
| RREB-1 | muscle | 6.5611 |
| NRSF | muscle | 6.44816 |
| MEF-2 | muscle | 23.6288 |
| E12 | muscle | 8.15327 |
| NRF-1 | liver | 6.24516 |
| NF-Y | eye | 9.71333 |
| ZIC2 | cervix | 6.22746 |
| USF2 | cervix | 6.26666 |
| PPARG | cervix | 10.1161 |
| PBX-1 | brain | 8.61385 |
| NRSF | brain | 12.3323 |
| NF-Y | brain | 8.1089 |
| LF-A1 | brain | 10.0991 |
| HNF-4 | brain | 7.70818 |
| GATA-1 | brain | 14.3153 |
| CACCC-BINDING_FACTOR | brain | 18.5897 |
| AR | brain | 11.448 |
| TATA | bone | 6.68996 |
| NF-E2 | bone | 11.8923 |
| MZF1 | bone | 6.59759 |
| HIF-1 | bone | 8.73544 |
| E2F | bone | 6.35387 |
| AP-4 | bone | 6.39107 |
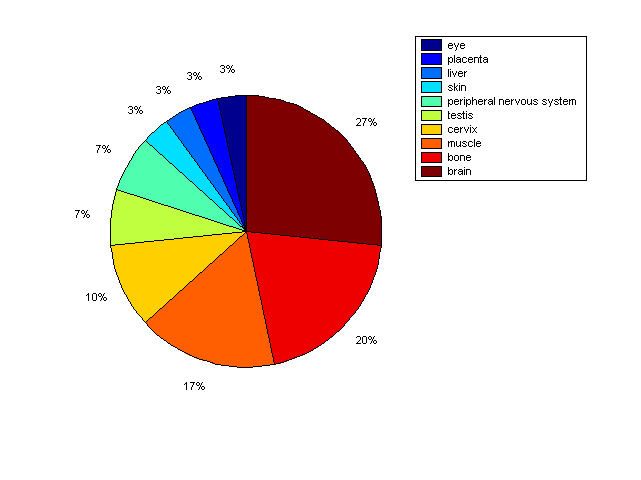
Distribution of Co-regulatory TFs
|
|
|
Description: this pie chart displays the distribution of co-regulatory transcription factors (TFs) in different tissues. Color schema: the tissue with the largest percentage of co-regulatory TFs is colored dark red whereas the tissue with the smallest percentage of co-regulatory TFs is colored dark blue. Tissues with intermediate percentages of co-regulatory TFs are colored from light red to yellow and cyan and then to light blue. |