Summary Table (Download Table)
| Co-regulatory TF | Tissue | -log(P) |
  | | |
| FOXJ2 | bone | 6.91434 |
| CHX10 | brain | 9.7598 |
| FOXO1 | brain | 7.97943 |
| FREAC-2 | brain | 6.27327 |
| GATA-X | brain | 7.1766 |
| POU3F2 | brain | 6.54554 |
| RREB-1 | brain | 9.67435 |
| TST-1 | brain | 6.88814 |
| AP-2REP | eye | 8.55851 |
| C/EBP | eye | 12.2573 |
| C/EBPALPHA | eye | 6.47626 |
| C/EBPBETA | eye | 6.64985 |
| HAND1/E47 | eye | 11.7781 |
| C/EBP | muscle | 6.46031 |
| CDP | peripheral_nervous_system | 8.89687 |
| IPF1 | peripheral_nervous_system | 6.93863 |
| NKX6-2 | peripheral_nervous_system | 7.02096 |
| POU3F2 | peripheral_nervous_system | 8.66709 |
| TBP | peripheral_nervous_system | 7.82367 |
| LHX3 | prostate | 6.89202 |
| NF-Y | soft_tissue | 7.4701 |
| E4BP4 | testis | 6.3212 |
| OCT-1 | testis | 6.47377 |
| NRF-1 | thymus | 6.35677 |
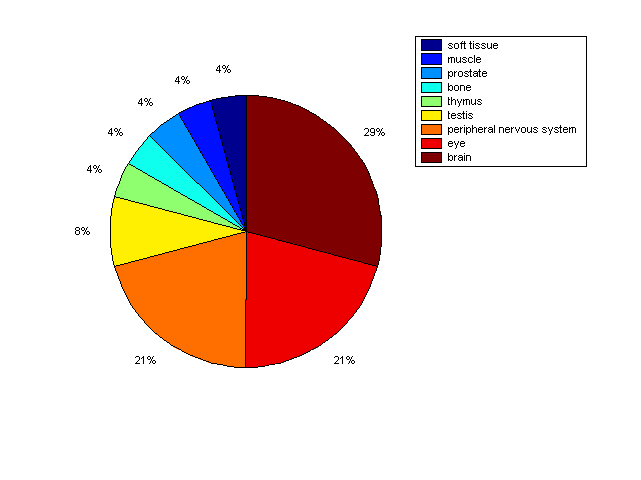
Distribution of Co-regulatory TFs
|
|
|
Description: this pie chart displays the distribution of co-regulatory transcription factors (TFs) in different tissues. Color schema: the tissue with the largest percentage of co-regulatory TFs is colored dark red whereas the tissue with the smallest percentage of co-regulatory TFs is colored dark blue. Tissues with intermediate percentages of co-regulatory TFs are colored from light red to yellow and cyan and then to light blue. |