| UniGene | Hs.113882 |
| RefSeq | NM_000815 |
| Symbol | GABRD |
| Description | Homo sapiens gamma-aminobutyric acid (GABA) A receptor, delta (GABRD), mRNA |
| Ensembl | ENSG00000187730 |
About the profile:
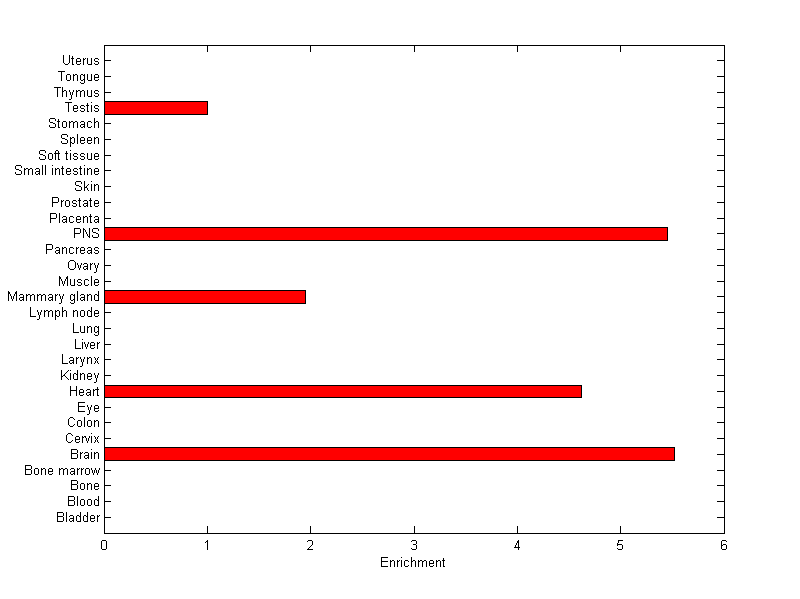
The expression level is normalized with tissue-library size. Each value for a gene in a tissue is a ratio of observed ESTs to the expected one in this tissue. The expected number of ESTs is the product of total ESTs of the gene and the fraction of total ESTs in the tissue among all ESTs in 30 tissues.
Summary:
This gene is preferentially expressed in [brain]
Download:
CRM Detection in brain
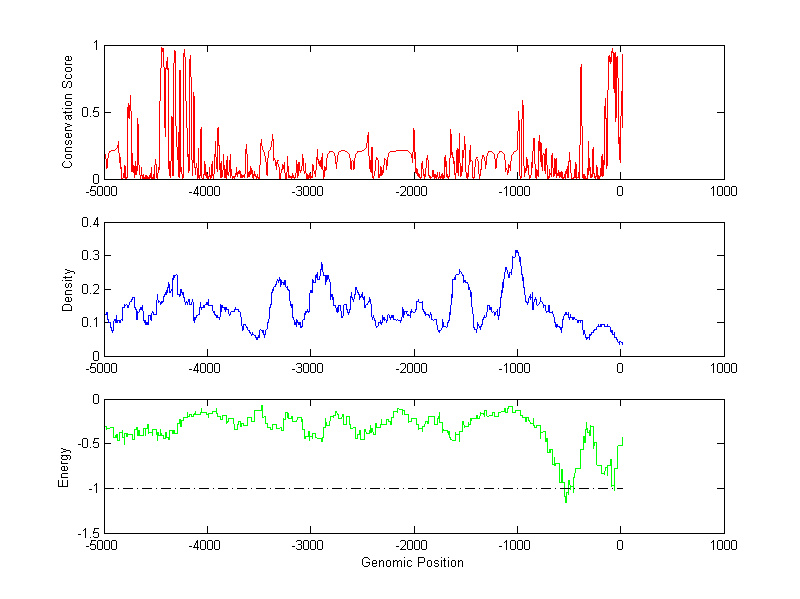
About the profiles:
The conservation profile (red curve) is about conservation scores of the promoter sequences. Conservation was determined from an eight-way alignment of human, chimpanzee, dog, mouse, rat, chicken, zebrafish and fugu sequences. The conservation was quantified by a conservation score between 0 and 1, with 1 as highest conservation. The conservation score was obtained from UCSC genome databases.
The density profile (blue curve) is about density of all TF binding sites.
The energy profile (green curve) is about energy for module detection based on TF interaction. The positions with energy less than -1 indicate the existence of CRMs.
Download:
Conservation profileDensity profile
Energy profile
CRM summary