HOME DOWNLOAD HELP


HELP page

 
Annotation
 
Spearman correlation
GSEA enrichment analysis
Adjusted Rand Index
 
User Guide
 
Browser compatibility
Data upload
Gene correlation
Sample correlation
Sample clustering
Group difference
Download


Spearman correlation

The Spearman correlation between two variables is equal to the Pearson correlation between the rank values of those two variables. Spearman correlation ranges from -1.0 to 1.0. A Spearman correlation value close to 1.0 (-1.0) indicates a strong positive (negative) monotonic relationships (whether linear or not) . 

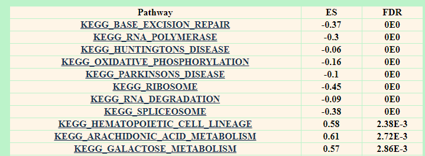
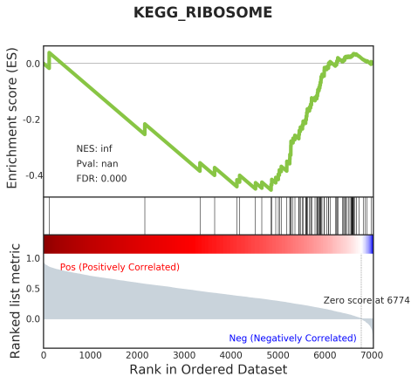
Preranked GSEA enrichment analysis

This function runs Gene Set Enrichment Analysis (GSEA) against a ranked list of genes based on correlation values or other measurements. A statistically significant enrichment indicates that the pathway characterized by the gene set is correlated with the user-supplied ranking.

Adjusted Rand Index

The Rand index is a measure of the similarity between two data clusterings. The adjusted Rand index is the corrected-for-chance version of the Rand index. The adjusted Rand index close to 1 indicating the high similarity between two data clusterings.


Browser compatibility

 
OS Version Chrome Firefox Safari Microsoft Edge
Windows 10 77.0.3865.90 57.0 n/a 44.17763.1.0
MacOS 10.12 Sierra not tested not tested 12.1.2 n/a
Linux Ubuntu 77.0.3865.90 57.0 n/a n/a

Data upload

Upload your 2 OMICS data files w/ or w/o sample annotation file via above upload form to start the integration analysis. Normally, the data should contain at least 10 samples. The data file must be prepared according to the FORMAT requirements and the file size must be less than 50M bytes. Click the submit button to initiate search.

Optionally, click sample submit button to initiate analysis using sample data.

Gene correlation

Histogram of gene-wise  correlations


List of gene correlations

Scatter plot of gene expression
between omics1 and omics2

Enriched pathways with high
positive/negative gene correlations

GSEA plot of Enriched pathway


The data matrices were firstly checked and filtered by overlapped genes and samples for further downstream integration and comparison analysis. For each overlapped gene, Spearman??s correlation is calculated across overlapped samples. The results are shown in the table and also downloadable in the result page. A correlation histogram is provided to visualize the consistency between two omics data from the gene-wise dimension. The correlation ranked gene list is further input into Gene Set Enrichment Analysis (GSEA) for pathway enrichment analysis using GSEApy (version 0.7.0) (https://github.com/BioNinja/gseapy). The significantly highly and lowly correlated pathways were listed in table. Clicking gene name and pathway name could lead to scatter plot of gene expression between two omics data and GSEA plot of significantly correlated pathway.

Sample correlation

Barplot of gene-wise correlations (index)


List of gene correlations to sample-wise index

Scatter plot between gene expression
and sample-wise index

Enriched pathways with high
positive/negative gene correlations

GSEA plot of Enriched pathway


For individual sample, sample-wise Spearman??s correlation is also calculated across overlapped genes and set as sample index for further analysis. If the sample annotation information is provided, the t test of sample index between one group and left groups will be done group by group. If any test show significance, the significance will be labelled with * in the bar plot of sample index. To identify genes associated with the sample phenotypes, we calculated correlation between the sample phenotypes and gene expressions across different samples. The ranked list is also input for pathway enrichment analysis as described in the gene-wise correlation section. Similar as those in gene-wise section, tables and figures for genes and significant pathways are also provided.


Sample clustering

omics1 Clustring using highly omics1-omics2
 correlated genes (group1)

omics2 Clustring using highly omics1-omics2
 correlated genes (group2)

omics1 Clustring using lowly omics1-omics2
 correlated genes (group3)

omics2 Clustring using lowly omics1-omics2
 correlated genes (group4)

Clustering integration

Clustering comparison


Sample heterogeneity is investigated using clustering analysis in this section. Four types of clustering are construct based on four different gene sets: the first using top half correlated genes in the first omics dataset; the second using top half correlated genes in the second omics dataset; the third using bottom half correlated genes in the first omics dataset; the fourth using bottom half correlated genes in the second omics dataset. The above four different group information and annotation information of the samples were gathered in a clustering heatmap, and adjusted Rand index (ARI) is calculated between different groups and displayed in ARI heatmap. ARI, a similarity measure between two clusters, has a value close to 0.0 for random labelling independently of the number of clusters and samples and exactly 1.0 when the clusters are identical.


Group difference

Group selection

Scatter plot of difference between
group1 and group2 of omics1 and omics2

List of gene difference

Boxplot between two groups
in omics1 and omics2

Enriched pathways with big/small
 gene differences

GSEA plot of Enriched pathway


Differential analysis module is available when sample annotation file is provided by the user. To start differential analysis, two annotation groups must be selected firstly. For each gene, fold change will be calculated between two groups in the first omics and the second omics data, separately. Scatter plot will be draw to show the fold change correlation between two dataset. For individual gene, the boxplot is provided. By the absolute value of log2 fold change, genes are also ranked for GSEA analysis to find the consistent/different differential pathways between two omics dataset. For each pathway, enrichment plot and scatter plot are provided.


Download


The download page will provide download of the python packages and manual files for users to process the data in-house.


 Report bugs to Webmaster